
Page 435 - T. Anderson-Fracture Mechanics - Fundamentals and Applns.-CRC (2005)
P. 435
1656_C009.fm Page 415 Monday, May 23, 2005 3:58 PM
Application to Structures 415
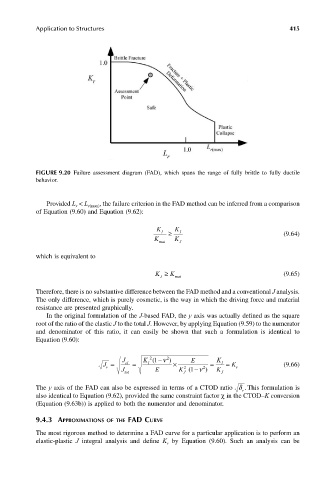
FIGURE 9.20 Failure assessment diagram (FAD), which spans the range of fully brittle to fully ductile
behavior.
Provided L < L r(max) , the failure criterion in the FAD method can be inferred from a comparison
r
of Equation (9.60) and Equation (9.62):
K I ≥ K I
K mat K J (9.64)
which is equivalent to
K J K ≥ mat (9.65)
Therefore, there is no substantive difference between the FAD method and a conventional J analysis.
The only difference, which is purely cosmetic, is the way in which the driving force and material
resistance are presented graphically.
In the original formulation of the J-based FAD, the y axis was actually defined as the square
root of the ratio of the elastic J to the total J. However, by applying Equation (9.59) to the numerator
and denominator of this ratio, it can easily be shown that such a formulation is identical to
Equation (9.60):
J K 1( −ν 2 ) E K
2
J = r J tot = I E × K ( 1 −ν 2 ) = K J I = K r (9.66)
el
2
J
The y axis of the FAD can also be expressed in terms of a CTOD ratio δ r . This formulation is
also identical to Equation (9.62), provided the same constraint factor χ in the CTOD–K conversion
(Equation (9.63b)) is applied to both the numerator and denominator.
9.4.3 APPROXIMATIONS OF THE FAD CURVE
The most rigorous method to determine a FAD curve for a particular application is to perform an
elastic-plastic J integral analysis and define K by Equation (9.60). Such an analysis can be
r