Page 436 - T. Anderson-Fracture Mechanics - Fundamentals and Applns.-CRC (2005)
P. 436
1656_C009.fm Page 416 Monday, May 23, 2005 3:58 PM
416 Fracture Mechanics: Fundamentals and Applications
complicated and time consuming, however. Simplified approximations of the FAD curve are
available. Two such approaches are outlined below.
In general, the shape of the FAD curve depends on material properties and geometry. However,
the geometry dependence can be virtually eliminated through a proper definition of L , as described
r
in Section 9.4.4. The following expression, which is based on the reference stress approach
described in Section 9.3.3, accounts for the material dependence in the FAD curve but assumes
that it is geometry independent [34]:
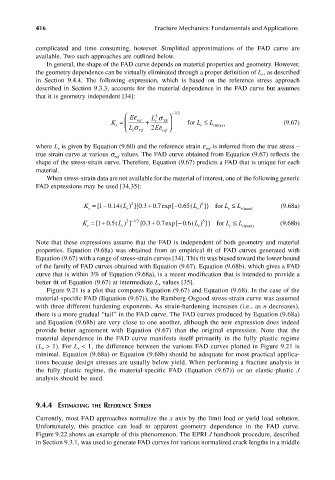
Eε L σ −12 /
3
K = r L σ ref S + 2 r Eε ref Lfor r L ≤ r (max) (9.67)
S
Y
r
Y
where L is given by Equation (9.60) and the reference strain e is inferred from the true stress –
r
ref
true strain curve at various s values. The FAD curve obtained from Equation (9.67) reflects the
ref
shape of the stress-strain curve. Therefore, Equation (9.67) predicts a FAD that is unique for each
material.
When stress-strain data are not available for the material of interest, one of the following generic
FAD expressions may be used [34,35]:
L =
K r − [1 014 ( ) ]{03 07 − . L . exp[ 065 r 6 L( ) ]} for r ≤ L r (max) (9.68a)
2
.
+ .
r
L =
K r + [10 . ( ) ] − /2 + { . 0 3 0 7 − .6 L . exp[ 0 r 6 L ( ) ]} for r ≤ L r (max) (9.68b)
2
1
5
r
Note that these expressions assume that the FAD is independent of both geometry and material
properties. Equation (9.68a) was obtained from an empirical fit of FAD curves generated with
Equation (9.67) with a range of stress-strain curves [34]. This fit was biased toward the lower bound
of the family of FAD curves obtained with Equation (9.67). Equation (9.68b), which gives a FAD
curve that is within 3% of Equation (9.68a), is a recent modification that is intended to provide a
better fit of Equation (9.67) at intermediate L values [35].
r
Figure 9.21 is a plot that compares Equation (9.67) and Equation (9.68). In the case of the
material-specific FAD (Equation (9.67)), the Ramberg-Osgood stress-strain curve was assumed
with three different hardening exponents. As strain-hardening increases (i.e., as n decreases),
there is a more gradual “tail” in the FAD curve. The FAD curves produced by Equation (9.68a)
and Equation (9.68b) are very close to one another, although the new expression does indeed
provide better agreement with Equation (9.67) than the original expression. Note that the
material dependence in the FAD curve manifests itself primarily in the fully plastic regime
(L > 1). For L < 1, the difference between the various FAD curves plotted in Figure 9.21 is
r
r
minimal. Equation (9.68a) or Equation (9.68b) should be adequate for most practical applica-
tions because design stresses are usually below yield. When performing a fracture analysis in
the fully plastic regime, the material-specific FAD (Equation (9.67)) or an elastic-plastic J
analysis should be used.
9.4.4 ESTIMATING THE REFERENCE STRESS
Currently, most FAD approaches normalize the x axis by the limit load or yield load solution.
Unfortunately, this practice can lead to apparent geometry dependence in the FAD curve.
Figure 9.22 shows an example of this phenomenon. The EPRI J handbook procedure, described
in Section 9.3.1, was used to generate FAD curves for various normalized crack lengths in a middle

