
Page 434 - T. Anderson-Fracture Mechanics - Fundamentals and Applns.-CRC (2005)
P. 434
1656_C009.fm Page 414 Monday, May 23, 2005 3:58 PM
414 Fracture Mechanics: Fundamentals and Applications
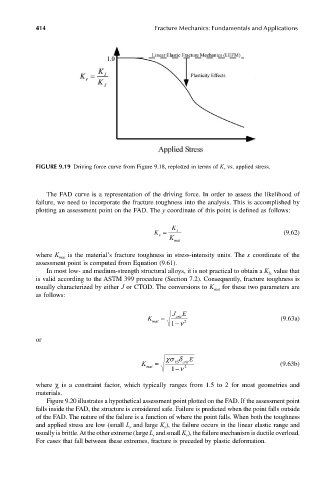
FIGURE 9.19 Driving force curve from Figure 9.18, replotted in terms of K r vs. applied stress.
The FAD curve is a representation of the driving force. In order to assess the likelihood of
failure, we need to incorporate the fracture toughness into the analysis. This is accomplished by
plotting an assessment point on the FAD. The y coordinate of this point is defined as follows:
K
I
K = K mat (9.62)
r
where K is the material’s fracture toughness in stress-intensity units. The x coordinate of the
mat
assessment point is computed from Equation (9.61).
In most low- and medium-strength structural alloys, it is not practical to obtain a K value that
Ic
is valid according to the ASTM 399 procedure (Section 7.2). Consequently, fracture toughness is
usually characterized by either J or CTOD. The conversions to K for these two parameters are
mat
as follows:
J E
K mat = crit (9.63a)
1 −ν 2
or
χσ δ E
K mat = YS crit (9.63b)
1 −ν 2
where χ is a constraint factor, which typically ranges from 1.5 to 2 for most geometries and
materials.
Figure 9.20 illustrates a hypothetical assessment point plotted on the FAD. If the assessment point
falls inside the FAD, the structure is considered safe. Failure is predicted when the point falls outside
of the FAD. The nature of the failure is a function of where the point falls. When both the toughness
and applied stress are low (small L and large K ), the failure occurs in the linear elastic range and
r
r
usually is brittle. At the other extreme (large L and small K ), the failure mechanism is ductile overload.
r
r
For cases that fall between these extremes, fracture is preceded by plastic deformation.