
Page 429 - T. Anderson-Fracture Mechanics - Fundamentals and Applns.-CRC (2005)
P. 429
1656_C009.fm Page 409 Monday, May 23, 2005 3:58 PM
Application to Structures 409
(a)
(b)
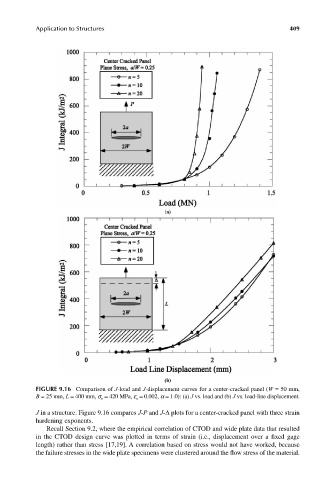
FIGURE 9.16 Comparison of J-load and J-displacement curves for a center-cracked panel (W = 50 mm,
B = 25 mm, L = 400 mm, s o = 420 MPa, e o = 0.002, a = 1.0): (a) J vs. load and (b) J vs. load-line displacement.
J in a structure. Figure 9.16 compares J-P and J-∆ plots for a center-cracked panel with three strain
hardening exponents.
Recall Section 9.2, where the empirical correlation of CTOD and wide plate data that resulted
in the CTOD design curve was plotted in terms of strain (i.e., displacement over a fixed gage
length) rather than stress [17,19]. A correlation based on stress would not have worked, because
the failure stresses in the wide plate specimens were clustered around the flow stress of the material.