
Page 161 - Fundamentals of Air Pollution
P. 161
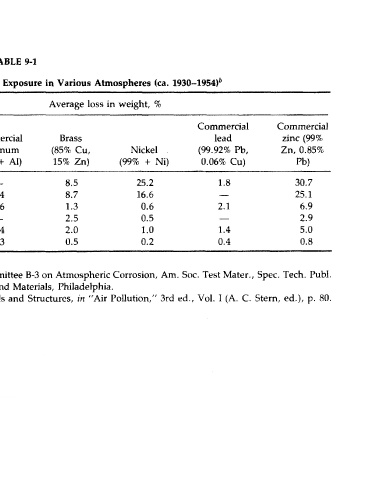
TABLE 9-1

 Weight Loss of Metal Panels* after 20 Years' Exposure in Various Atmospheres (ca. 1930-1954) 6
      Average loss in weight, %
                               Commercial    Commercial
 Commercial  Commercial  Brass    lead        zinc (99%
 Exposure  copper  aluminum  (85% Cu,  Nickel  (99.92% Pb,  Zn, 0.85%
 City  classification  (99.9% + Cu)  (99% + Al)  15% Zn)  (99% + Ni)  0.06% Cu)  Pb)
 Altoona, PA  Industrial  6.1  8.5  25.2  1.8   30.7
 New York, NY  Industrial  6.4  3.4  8.7  16.6  —  25.1
 La Jolla, CA  Seacoast  5.4  2.6  1.3  0.6  2.1  6.9
 Key West, FL  Seacoast  2.4  —  2.5  0.5  —     2.9
 State College, PA  Rural  1.9  0.4  2.0  1.0  1.4  5.0
 Phoenix, AZ  Rural  0.6  0.3  0.5  0.2  0.4     0.8
 3
  Panels—9 x 12 x 0.035 in (22.86 x 30.48 x 0.089 cm).
 * Data from H. R. Copson, Report of ASTM Subcommittee VI, of Committee B-3 on Atmospheric Corrosion, Am. Soc. Test Mater., Spec. Tech. Publ.
 175, 1955. Used by permission of the American Society for Testing and Materials, Philadelphia.
 Source: Yocom, J. E., and Upham, J. B., Effects on Economic Materials and Structures, in "Air Pollution," 3rd ed., Vol. I (A. C. Stern, ed.), p. 80.
 Academic Press, New York, 1977.