
Page 181 - Fundamentals of Computational Geoscience Numerical Methods and Algorithms
P. 181
7.3 Verification and Application of the Equivalent Source Algorithm 171
larger, but the maximum temperature generated by the intruded magma becomes
smaller and smaller. These phenomena can be clearly seen from Fig. 7.8, where the
temperature distributions of the dike-like magma intrusion problem are displayed
along two typical cross-sections of the computational model. For instance, the max-
◦
◦
imum temperature along the cross-section of x = 20,100 m is 514.8 C, 444.4 C,
◦
◦
394.4 C and 354.9 C for the time instants of 1.8765 × 10 11 s, 4.6673 × 10 11 s,
9.3826 × 10 11 s and 1.8765 × 10 12 s respectively. Although the total temperature
localization area generated by the intruded magma is limited in the top part of the
LEGEND
A – 0.5000E–03
B – 0.1500E–02
C – 0.2500E–02
D – 0.3500E–02
E – 0.4500E–02
F – 0.5500E–02
G – 0.6500E–02
A
H – 0.7500E–02
I – 0.8500E–02
J – 0.9500E–02
(t = . 9 3826 × 10 9 s )
LEGEND
A – 0.5000E–03
B – 0.1500E–02
C – 0.2500E–02
D – 0.3500E–02
E – 0.4500E–02
F – 0.5500E–02
A G – 0.6500E–02
H – 0.7500E–02
I – 0.8500E–02
J – 0.9500E–02
(t = . 9 3826 × 10 10 s )
LEGEND
A – 0.5000E–03
B – 0.1500E–02
C – 0.2500E–02
D – 0.3500E–02
E – 0.4500E–02
F – 0.5500E–02
A G – 0.6500E–02
D B H – 0.7500E–02
A B E C I – 0.8500E–02
C J – 0.9500E–02
(t = . 1 8765× 10 11 s )
LEGEND
A – 0.5000E–03
B – 0.1500E–02
C – 0.2500E–02
D – 0.3500E–02
A E – 0.4500E–02
F – 0.5500E–02
G – 0.6500E–02
H – 0.7500E–02
A B C B I – 0.8500E–02
J – 0.9500E–02
(t = . 4 6673× 10 11 s )
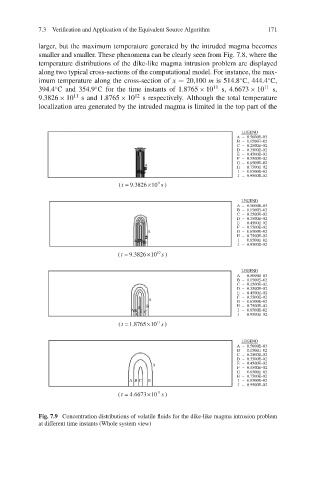
Fig. 7.9 Concentration distributions of volatile fluids for the dike-like magma intrusion problem
at different time instants (Whole system view)