
Page 182 - Fundamentals of Computational Geoscience Numerical Methods and Algorithms
P. 182
172 7 Simulating Thermal and Chemical Effects of Intruded Magma Solidification Problems
computational model, it is large enough to cause convective pore-fluid flow within
the whole system (Zhao et al. 1997a), if the porous rocks are saturated by the pore-
fluid in the upper crust of the Earth. Once this convective pore-fluid flow takes place,
temperature localization in the top part of the computational model can be signif-
icantly enhanced so that a favourable region for ore body formation and mineral-
ization can be created just above the intruded dike-like magma (Zhao et al. 1998a).
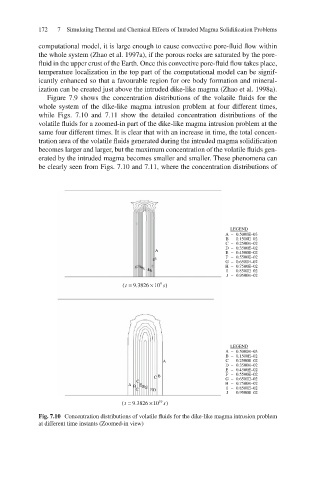
Figure 7.9 shows the concentration distributions of the volatile fluids for the
whole system of the dike-like magma intrusion problem at four different times,
while Figs. 7.10 and 7.11 show the detailed concentration distributions of the
volatile fluids for a zoomed-in part of the dike-like magma intrusion problem at the
same four different times. It is clear that with an increase in time, the total concen-
tration area of the volatile fluids generated during the intruded magma solidification
becomes larger and larger, but the maximum concentration of the volatile fluids gen-
erated by the intruded magma becomes smaller and smaller. These phenomena can
be clearly seen from Figs. 7.10 and 7.11, where the concentration distributions of
LEGEND
A – 0.5000E–03
B – 0.1500E–02
C – 0.2500E–02
D – 0.3500E–02
A E – 0.4500E–02
F – 0.5500E–02
G – 0.6500E–02
H – 0.7500E–02
I – 0.8500E–02
J – 0.9500E–02
(t = . 9 3826 × 10 9 s)
LEGEND
A – 0.5000E–03
B – 0.1500E–02
A C – 0.2500E–02
D – 0.3500E–02
E – 0.4500E–02
0.5500E–02
C B F G – – 0.6500E–02
C
A B E F G H – 0.7500E–02
C E D I – 0.8500E–02
J – 0.9500E–02
(t = . 9 3826 × 10 10 s)
Fig. 7.10 Concentration distributions of volatile fluids for the dike-like magma intrusion problem
at different time instants (Zoomed-in view)