
Page 102 - Fundamentals of Gas Shale Reservoirs
P. 102
82 SEQUENCE STRATIGRAPHY OF UNCONVENTIONAL RESOURCE SHALES
by Donovan and Staerker, 2010) of the underlying Buda studies have subdivided the LaLuna into the lower Salada
Limestone. Above this interval, the gamma ray log response (black shales, black mudstones, black calcareous claystone,
diminishes progressively upward, indicating an HST. Super black limestone layers with internal pyritized concretions),
imposed on this second‐order sequence are a number of middle Pujamana (claystone, mudstone, gray shale, and
third‐order sequences; three additional SBs and mfss have cherts), and upper Galembo (calcareous shales with lime
been recognized on the outcrop and extended to subsurface stone layers and nodules) members. There are no well logs
wells; more high‐frequency sequences occur throughout the available, but based upon geochemical analysis of outcrop
Eagle Ford at the outcrop and subsurface sites. samples, a preliminary sequence stratigraphic framework has
been established (Fig. 4.15) (Torres‐Parada, 2013).
Included in this framework is a residual hydrocarbon
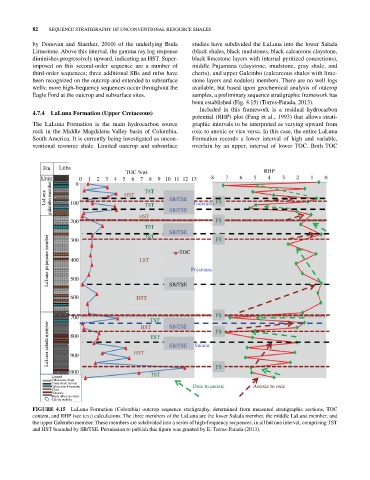
4.7.4 LaLuna Formation (upper Cretaceous)
potential (RHP) plot (Fang et al., 1993) that allows strati
The LaLuna Formation is the main hydrocarbon source graphic intervals to be interpreted as varying upward from
rock in the Middle Magdalena Valley basin of Colombia, oxic to anoxic or vice versa. In this case, the entire LaLuna
South America. It is currently being investigated as uncon Formation records a lower interval of high and variable,
ventional resource shale. Limited outcrop and subsurface overlain by an upper, interval of lower TOC. Both TOC
Fm Litha
TOC %wt RHP
Umir 0 0 1 2 3 4 5 6 7 8 9 10 11 12 13 8 7 6 5 4 3 2 1 0
galembo member 100 TST SB/TSE Galembo FS
LaLuna HST TST
HST SB/TSE
200 FS
T
TST
SB/TSE FS
TST
LaLuna pujamana member 400 LST TOC Pujamana
300
500
600 HST SB/TSE
700 HST TST SB/TSE FS
LaLuna salada member 800 HST TST SB/TSE Salada FS
900
1000 FS
Legend TST
Calcareous shale
Coaly shale lamina
Calcareous limestone Oxic to anoxic Anoxic to oxic
Chert
Siltstone
Black siliceous shale
Calcite nodules
FIGurE 4.15 LaLuna Formation (Colombia) outcrop sequence stratigraphy, determined from measured stratigraphic sections, TOC
content, and RHP (see text) calculations. The three members of the LaLuna are the lower Salada member, the middle LaLuna member, and
the upper Galembo member. These members are subdivided into a series of high‐frequency sequences, in all but one interval, comprising TST
and HST bounded by SB/TSE. Permission to publish this figure was granted by E. Torres‐Parada (2013).