
Page 99 - Fundamentals of Gas Shale Reservoirs
P. 99
Marcellus shale
gamma-ray
4707700284 4707700320
Third order Fourth order? Oatka creek
Oatka creek member Second order RST
50 ft Union springs
fs
TST mfs
HST
Union springs member Third order TST
Onondaga Ls rs SB/TSE
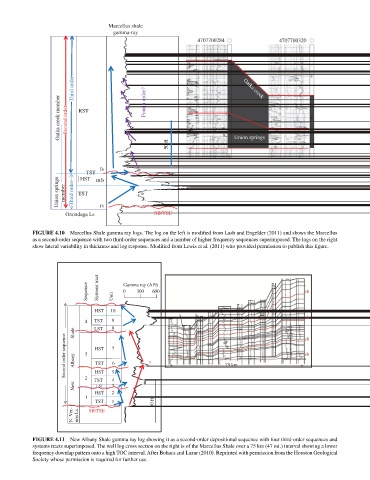
FIGurE 4.10 Marcellus Shale gamma ray logs. The log on the left is modified from Lash and Engelder (2011) and shows the Marcellus
as a second‐order sequence with two third‐order sequences and a number of higher frequency sequences superimposed. The logs on the right
show lateral variability in thickness and log response. Modified from Lewis et al. (2011) who provided permission to publish this figure.
Sequence Systems tract Unit Gamma ray (API) sb
600
0
300
HST 10
sb
4 TST 9 8
LST
Shale
Second order sequence Albany 3 HST 7 6 ? 75 km sb
sb
TST
HST
New 2 TST 5 4 3
LST
HST 2
1
TST 1 50 ft
N. Ver- non Ls. SB/TSE
FIGurE 4.11 New Albany Shale gamma ray log showing it as a second‐order depositional sequence with four third‐order sequences and
systems tracts superimposed. The well log cross section on the right is of the Marcellus Shale over a 75 km (47 mi.) interval showing a lower
frequency downlap pattern onto a high TOC interval. After Bohacs and Lazar (2010). Reprinted with permission from the Houston Geological
Society whose permission is required for further use.