
Page 95 - Fundamentals of Gas Shale Reservoirs
P. 95
GR (GAP) Relative
0 200 Core gamma ray
sea level
7250 7250 Shallow Deep
Upper barnett shale
7300
7350
7375
Smoothed Forestburg Ls. Forestburg
gamma-ray log 100 ft
7500 Third order (1.5 Myr.)
7500 7550
Second order (22 Myr) 7600
7625 7650 Lower barnett shale
7700
7750 7750
Base barnett
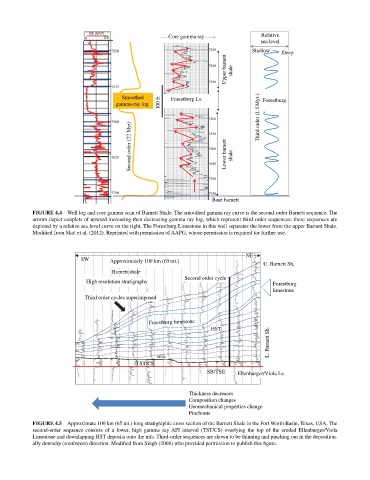
FIGurE 4.4 Well log and core gamma scan of Barnett Shale. The smoothed gamma ray curve is the second‐order Barnett sequence. The
arrows depict couplets of upward increasing‐then decreasing gamma ray log, which represent third order sequences; these sequences are
depicted by a relative sea level curve on the right. The Forestburg Limestone in this well separates the lower from the upper Barnett Shale.
Modified from Slatt et al. (2012). Reprinted with permission of AAPG, whose permission is required for further use.
NE
SW Approximately 100 km (65 mi.) U. Barnett Sh,
Barnett shale
Second order cycle
High resolution stratigraphy Forestburg
limestone
Third order cycles superimposed
Forestburg limestone
L. Barnett Sh.
HST
mfs
TST/CS
SB/TSE Ellenburger/Viola Ls.
Thickness decreases
Composition changes
Geomechanical properties change
Pinchouts
FIGurE 4.5 Approximate 100 km (65 mi.) long stratigraphic cross section of the Barnett Shale in the Fort Worth Basin, Texas, USA. The
second‐order sequence consists of a lower, high gamma ray API interval (TST/CS) overlying the top of the eroded Ellenburger/Viola
Limestone and downlapping HST deposits onto the mfs. Third‐order sequences are shown to be thinning and pinching out in the deposition
ally downdip (southwest) direction. Modified from Singh (2008) who provided permission to publish this figure.