
Page 96 - Fundamentals of Gas Shale Reservoirs
P. 96
76 SEQUENCE STRATIGRAPHY OF UNCONVENTIONAL RESOURCE SHALES
Core gamma ray scan (c) (d)
Core Core gemma ray 0.0 (CPM) 1000
scan (CPM)
0.0 1000
GRP-14
GRP-13 50
300 GRP-12 ft.
GRP-11
(b) (e)
GRP-10
400 Forestburg
500 GRP-9
GRP-8
GRP-7
GRP-6
GRP-5 (a)
600 (f)
GRP-4
GRP-3
GRP-2
700
GRP-1
TSE
Viola
More clay upward Less clay upward
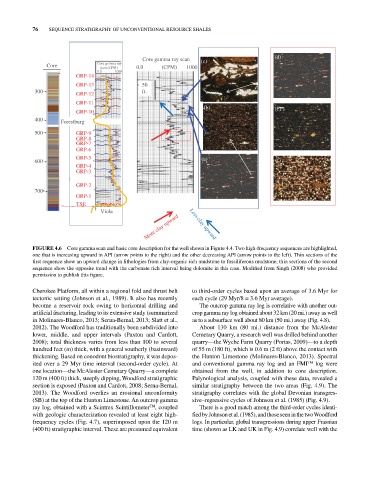
FIGurE 4.6 Core gamma scan and basic core description for the well shown in Figure 4.4. Two high‐frequency sequences are highlighted,
one that is increasing upward in API (arrow points to the right) and the other decreasing API (arrow points to the left). Thin sections of the
first sequence show an upward change in lithologies from clay‐organic rich mudstone to fossiliferous mudstone; thin sections of the second
sequence show the opposite trend with the carbonate rich interval being dolomite in this case. Modified from Singh (2008) who provided
permission to publish this figure.
Cherokee Platform, all within a regional fold and thrust belt to third‐order cycles based upon an average of 3.6 Myr for
tectonic setting (Johnson et al., 1989). It also has recently each cycle (29 Myr/8 = 3.6 Myr average).
become a reservoir rock owing to horizontal drilling and The outcrop gamma ray log is correlative with another out
artificial fracturing, leading to its extensive study (summarized crop gamma ray log obtained about 32 km (20 mi.) away as well
in Molinares‐Blanco, 2013; Serna‐Bernal, 2013; Slatt et al., as to a subsurface well about 80 km (50 mi.) away (Fig. 4.8).
2012). The Woodford has traditionally been subdivided into About 130 km (80 mi.) distance from the McAlester
lower, middle, and upper intervals (Paxton and Cardott, Cemetary Quarry, a research well was drilled behind another
2008); total thickness varies from less than 100 to several quarry—the Wyche Farm Quarry (Portas, 2009)—to a depth
hundred feet (m) thick, with a general southerly (basinward) of 55 m (180 ft), which is 0.6 m (2 ft) above the contact with
thickening. Based on conodont biostratigraphy, it was depos the Hunton Limestone (Molinares‐Blanco, 2013). Spectral
ited over a 29 Myr time interval (second‐order cycle). At and conventional gamma ray log and an FMI log were
TM
one location—the McAlester Cemetary Quarry—a complete obtained from the well, in addition to core description.
120 m (400 ft) thick, steeply dipping, Woodford stratigraphic Palynological analysis, coupled with these data, revealed a
section is exposed (Paxton and Cardott, 2008; Serna‐Bernal, similar stratigraphy between the two areas (Fig. 4.9). The
2013). The Woodford overlies an erosional unconformity stratigraphy correlates with the global Devonian transgres
(SB) at the top of the Hunton Limestone. An outcrop gamma sive–regressive cycles of Johnson et al. (1985) (Fig. 4.9).
ray log, obtained with a Scintrex Scintillometer , coupled There is a good match among the third‐order cycles identi
TM
with geologic characterization revealed at least eight high‐ fied by Johnson et al. (1985), and those seen in the two Woodford
frequency cycles (Fig. 4.7), superimposed upon the 120 m logs. In particular, global transgressions during upper Frasnian
(400 ft) stratigraphic interval. These are presumed equivalent time (shown as LK and UK in Fig. 4.9) correlate well with the