
Page 94 - Fundamentals of Gas Shale Reservoirs
P. 94
74 SEQUENCE STRATIGRAPHY OF UNCONVENTIONAL RESOURCE SHALES
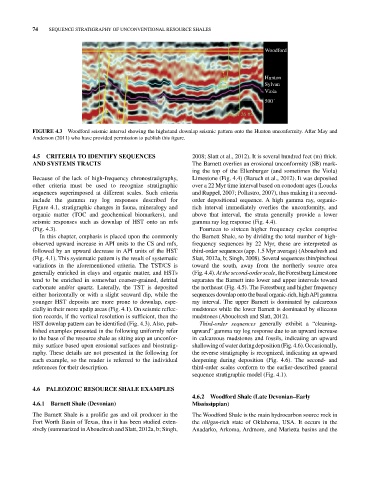
Woodford
Hunton
Sylvan
Viola
500´
Stover 26 #2
FIGurE 4.3 Woodford seismic interval showing the highstand downlap seismic pattern onto the Hunton unconformity. After May and
Anderson (2011) who have provided permission to publish this figure.
4.5 CrITErIa TO IDENTIFy SEQuENCES 2008; Slatt et al., 2012). It is several hundred feet (m) thick.
aND SySTEmS TraCTS The Barnett overlies an erosional unconformity (SB) mark
ing the top of the Ellenburger (and sometimes the Viola)
Because of the lack of high‐frequency chronostratigraphy, Limestone (Fig. 4.4) (Baruch et al., 2012). It was deposited
other criteria must be used to recognize stratigraphic over a 22 Myr time interval based on conodont ages (Loucks
sequences superimposed at different scales. Such criteria and Ruppel, 2007; Pollastro, 2007), thus making it a second‐
include the gamma ray log responses described for order depositional sequence. A high gamma ray, organic‐
Figure 4.1, stratigraphic changes in fauna, mineralogy and rich interval immediately overlies the unconformity, and
organic matter (TOC and geochemical biomarkers), and above that interval, the strata generally provide a lower
seismic responses such as downlap of HST onto an mfs gamma ray log response (Fig. 4.4).
(Fig. 4.3). Fourteen to sixteen higher frequency cycles comprise
In this chapter, emphasis is placed upon the commonly the Barnett Shale, so by dividing the total number of high‐
observed upward increase in API units to the CS and mfs, frequency sequences by 22 Myr, these are interpreted as
followed by an upward decrease in API units of the HST third‐order sequences (app. 1.5 Myr average) (Abouelresh and
(Fig. 4.1). This systematic pattern is the result of systematic Slatt, 2012a, b; Singh, 2008). Several sequences thin/pinchout
variations in the aforementioned criteria. The TST/CS is toward the south, away from the northerly source area
generally enriched in clays and organic matter, and HSTs (Fig. 4.4). At the second‐order scale, the Forestburg Limestone
tend to be enriched in somewhat coarser‐grained, detrital separates the Barnett into lower and upper intervals toward
carbonate and/or quartz. Laterally, the TST is deposited the northeast (Fig. 4.5). The Forestburg and higher frequency
either horizontally or with a slight seaward dip, while the sequences downlap onto the basal organic‐rich, high API gamma
younger HST deposits are more prone to downlap, espe ray interval. The upper Barnett is dominated by calcareous
cially in their more updip areas (Fig. 4.1). On seismic reflec mudstones while the lower Barnett is dominated by siliceous
tion records, if the vertical resolution is sufficient, then the mudstones (Abouelresh and Slatt, 2012).
HST downlap pattern can be identified (Fig. 4.3). Also, pub Third‐order sequences generally exhibit a “cleaning‐
lished examples presented in the following uniformly refer upward” gamma ray log response due to an upward increase
to the base of the resource shale as sitting atop an unconfor in calcareous mudstones and fossils, indicating an upward
mity surface based upon erosional surfaces and biostratig shallowing of water during deposition (Fig. 4.6). Occasionally,
raphy. These details are not presented in the following for the reverse stratigraphy is recognized, indicating an upward
each example, so the reader is referred to the individual deepening during deposition (Fig. 4.6). The second‐ and
references for their description. third‐order scales conform to the earlier‐described general
sequence stratigraphic model (Fig. 4.1).
4.6 PaLEOZOIC rESOurCE SHaLE EXamPLES
4.6.2 Woodford Shale (Late Devonian–Early
4.6.1 Barnett Shale (Devonian) mississippian)
The Barnett Shale is a prolific gas and oil producer in the The Woodford Shale is the main hydrocarbon source rock in
Fort Worth Basin of Texas, thus it has been studied exten the oil/gas‐rich state of Oklahoma, USA. It occurs in the
sively (summarized in Abouelresh and Slatt, 2012a, b; Singh, Anadarko, Arkoma, Ardmore, and Marietta basins and the