Page 104 - Fundamentals of Gas Shale Reservoirs
P. 104

84   SEQUENCE STRATIGRAPHY OF UNCONVENTIONAL RESOURCE SHALES

              To date, a final sequence stratigraphic framework has not   the Brown Shale (Brito, 2014). Comparison of typical strati­
            been fully developed for this shale, but it does have similar   graphic sequences and gamma ray logs from these shales
            gamma‐log stratigraphy at least at two scales. If the Brown   reveals a similarity in their characteristics—most notably
            Shale is entirely lacustrine in origin, it suggests that the   a  combined basal unconformity atop underlying strata
            effects of sea‐level cyclicity can extend well into the paleo­  (sequence boundary‐SB) and a transgressive surface of
            landward direction either through connections to the ocean   erosion (TSE)—which are overlain by a fining‐upward
            or by the lowering of fluvial base level.            shaley interval capped by an organic‐rich, high gamma ray
                                                                 shale, which in turn is overlain by an upward‐decreasing API
                                                                 gamma ray pattern.  This similarity among different‐aged/
            4.9  CONCLuSIONS                                     environment shales  suggests a generally  similar mode of
                                                                 formation even though specific mineralogic and lithologic
            In this chapter, we have compared stratigraphy from well   compositions may differ. The formative processes adhere to
            logs and from outcrop/core of a variety of shales of differing   a general sequence stratigraphic model (Fig. 4.1) that can be
            age.  Traditional  and  conventional  sequence  stratigraphic   applied at multiple scales within a shale sequence.
            principles and analysis have been applied to the Barnett
            Shale (Abouelresh and Slatt, 2012a, b; Loucks and Ruppel,
            2007; Singh, 2008; Slatt et al., 2012); the Woodford Shale   4.10 aPPLICaTIONS
            (Molinares‐Blanco, 2013; Serna‐Bernal, 2013); New Albany
            Shale (Bohacs and Lazar, 2010), Marcellus Shale (Lash and   The most important application of sequence stratigraphy to
            Engelder, 2011), Haynesville Shale (Goldhammer, 1998;   shales is the ability to correlate strata over long distances
            Hammes et al., 2011), Eagle Ford Shale (Donovan and   with  some  degree  of  confidence,  even  when  chronostrati­
            Staerker, 2010); LaLuna Shale (Torres‐Parada, 2013), and   graphic information is not available. Not only is a predictable

                                                Average P-                      Average P-
                                               impedance map  Average TOC map.  impedance map  Average TOC map.
                         GR
                        Bad_hole             (a)       P-impedance  (b)       (a)      P-impedance  (b)
                       0.00  10.00                     Ft.g/s.cc       TOC (wr%)        Ft.g/s.cc     W-4  TOC (wr%)
                                                                                                        14.00
                         GR                          W-4  27000      W-4  14.00       W-4  27000
                                                                                         26000
                                                                        12.00
                       0  gAPI  800                     26000           10.00            25000          12.00
                                                        25000
                                                                                         24000
                                                                                                        10.00
                                                        24000
                         Color  ll               W-19   23000    W-19   8.00      W-19   23000    W-19
                                                                                         22000
                   20 ft                                22000           6.00             21000          8.00
                                                        21000
                                                        20000
                                             W-6  W-16  19000  W-6  W-16      W-6  W-16  20000  W-6  W-16  6.00
                                                                                         19000
                                                        18000
                                                                                         18000
                                             W-3  W-17       W-3 W-17         W-3 W-17       W-3 W-17
                                                              W-15
                                                                                               W-15
                                               W-15
                                                                                W-15
                                             W-1  W-5   W-14  W-1  W-5  W-14  W-1  W-5   W-14  W-1  W-5  W-14
                   GRP-10                           W-12           W-12              W-12           W-12
                   GRP-9                           W-10  W-2 W-11  W-7  W-10 W-2  W-11  W-7  W-10 W-2  W-11  W-7  W-10 W-2  W-11  W-7
                                                       W-21       W-18  W-21           W-21       W-18  W-21
                                                  W-18                W-20         W-18  W-20          W-20
                                                       W-20
                                                                    W-8                              W-8
                                                     W-8               W-13           W-8               W-13
                                                       W-13                              W-13
                                              W-9             W-9              W-9             W-9
                                               0  5000  10000ftUS  0  5000  10000ftUS  0  5000  10000ftUS  0  5000  10000ftUS
                   GRP-8
                                              (c)      FG (psi/ft)  (d)  Thickness(ft)  (c)  FG (psi/ft)  (d)  Thickness(ft)
                                                                                                        19.60
                                                                        10.00
                                                     W-4
                                                        0.75        W-4  9.60         W-4  0.75      W-4  19.20
                                                        0.70            9.20             0.70           18.80
                                                                        8.80
                                                                                                        18.40
                                                        0.65            8.40             0.65           18.00
                                                 W-19            W-19   8.00      W-19            W-19  17.60
                   GRP-7                                0.60            7.60             0.60           17.20
                                                        0.55            7.20             0.55           16.80
                                             W-6  W-16  0.50  W-6  W-16  6.80  W-6  W-16  0.50  W-6  W-16  16.40
                   GRP-6                     W-3  W-17       W-3 W-17         W-3 W-17       W-3 W-17
                                                                                               W-15
                                              W-15
                                                                                W-15
                                                              W-15
                                             W-1  W-5  W-14  W-1  W-5  W-14   W-1  W-5  W-14  W-1  W-5  W-14
                                                   W-12            W-12              W-12           W-12
                   GRP-5
                                                   W-10 W-2  W-7  W-10  W-2  W-7   W-10 W-2  W-7   W-10 W-2  W-7
                                                      W-11            W-11             W-11            W-11
                                                      W-21            W-21             W-21            W-21
                                                  W-18           W-18              W-18            W-18
                   GRP-4                              W-20            W-20             W-20            W-20
                                                     W-8            W-8               W-8            W-8
                                                       W-13            W-13             W-13            W-13
                                              W-9             W-9              W-9             W-9
                   GRP-3                      0   5000  10000ftUS  0  5000  10000ftUS  0  5000  10000ftUS  0  5000  10000ftUS
                                                               Isopach map     Average fracture   Isopach map
                                            Average fracture                    gradient map
                   GRP-2                     gradient map
                                                              GRP 4                      GRP 5
                   GRP-1
                            Ra                                           Ductile–Brittle couplet
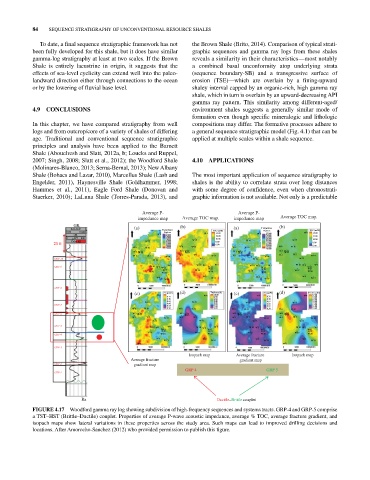
            FIGurE 4.17  Woodford gamma ray log showing subdivision of high‐frequency sequences and systems tracts. GRP‐4 and GRP‐5 comprise
            a TST–HST (Brittle–Ductile) couplet. Properties of average P‐wave acoustic impedance, average % TOC, average fracture gradient, and
            isopach maps show lateral variations in these properties across the study area. Such maps can lead to improved drilling decisions and
              locations. After Amorocho‐Sanchez (2012) who provided permission to publish this figure.
   99   100   101   102   103   104   105   106   107   108   109