Page 151 - Fundamentals of Gas Shale Reservoirs
P. 151

WELL LOG ANALYSIS OF GAS SHALE RESERVOIRS  131
              (a)                                               (b)
                 250       R = 0.07                                250       R = 0.45
                Generated HC (bbl/ac-ft)    150                  Generated HC (bbl/ac-ft)  150
                            2
                                                                   200
                 200
                                                                              2

                                                                   100
                 100
                  50

                   0                                                50
                                                                    0
                     1            2            3            4         1            2            3            4
                                     TOC (wt%)                                        iTOC (wt%)
                                        (c)
                                           250    R  = 0.68
                                          Generated HC (bbl/ac-ft)   150
                                                   2
                                           200


                                           100

                                            50

                                            0
                                             420       430      440       450      460
                                                              T max  (ºC)

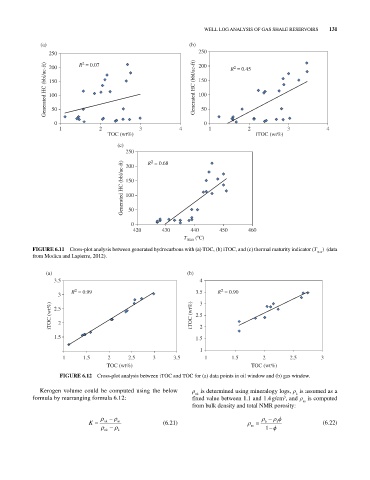
            FIGURE 6.11  Cross‐plot analysis between generated hydrocarbons with (a) TOC, (b) iTOC, and (c) thermal maturity indicator (T max )  (data
            from Modica and Lapierre, 2012).


                (a)                                            (b)
                   3.5                                             4
                                                                          2
                          2
                    3    R  = 0.99                                3.5 3  R  = 0.90
                  iTOC (wt%)  2.5                               iTOC (wt%)  2.5 2


                    2

                   1.5                                            1.5

                                                                   1
                      1     1.5      2     2.5      3     3.5        1        1.5       2        2.5       3
                                    TOC (wt%)                                       TOC (wt%)
                     FIGURE 6.12  Cross‐plot analysis between iTOC and TOC for (a) data points in oil window and (b) gas window.

              Kerogen volume could be computed using the below   ρ  is determined using mineralogy logs, ρ  is assumed as a
                                                                                                   k
                                                                  nk
              formula by rearranging formula 6.12:               fixed value between 1.1 and 1.4 g/cm , and ρ  is computed
                                                                                               3
                                                                                                     m
                                                                 from bulk density and total NMR porosity:
                              K    nk   m              (6.21)                       m    b   f              (6.22)
                                    nk  k                                                1
   146   147   148   149   150   151   152   153   154   155   156