
Page 152 - Fundamentals of Gas Shale Reservoirs
P. 152
132 PETROPHYSICAL EVALUATION OF GAS SHALE RESERVOIRS
10 Low
8
W TOC from pulsed neutron (wt%) 6 k assumed < real assumed k assumed = real Young’s modulus (GPa) BI (%) 0
k
k
4
>
real
k
k
2
100
High
Low High
0 Poisson’s ratio
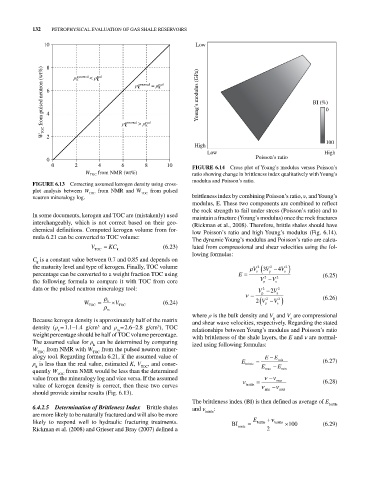
0 2 4 6 8 10 FIGURE 6.14 Cross plot of Young’s modulus versus Poisson’s
W TOC from NMR (wt%) ratio showing change in brittleness index qualitatively with Young’s
modulus and Poisson’s ratio.
FIGURE 6.13 Correcting assumed kerogen density using cross‐
plot analysis between W TOC from NMR and W TOC from pulsed
neutron mineralogy log. brittleness index by combining Poisson’s ratio, ν, and Young’s
modulus, E. These two components are combined to reflect
the rock strength to fail under stress (Poisson’s ratio) and to
In some documents, kerogen and TOC are (mistakenly) used maintain a fracture (Young’s modulus) once the rock fractures
interchangeably, which is not correct based on their geo (Rickman et al., 2008). Therefore, brittle shales should have
chemical definitions. Computed kerogen volume from for low Poisson’s ratio and high Young’s modulus (Fig. 6.14).
mula 6.21 can be converted to TOC volume:
The dynamic Young’s modulus and Poisson’s ratio are calcu
V TOC KC k (6.23) lated from compressional and shear velocities using the fol
lowing formulas:
C is a constant value between 0.7 and 0.85 and depends on
k
the maturity level and type of kerogen. Finally, TOC volume V 2 3 V 2 4 V 2
percentage can be converted to a weight fraction TOC using E s 2 p 2 s (6.25)
the following formula to compare it with TOC from core V p V s
data or the pulsed neutron mineralogy tool: V p 2 2 V s 2
W TOC k V TOC (6.24) 2 V p 2 V s 2 (6.26)
m
where ρ is the bulk density and V and V are compressional
p
s
Because kerogen density is approximately half of the matrix and shear wave velocities, respectively. Regarding the stated
density (ρ = 1.1–1.4 g/cm and ρ = 2.6–2.8 g/cm ), TOC relationships between Young’s modulus and Poisson’s ratio
3
3
k
m
weight percentage should be half of TOC volume percentage. with brittleness of the shale layers, the E and ν are normal
The assumed value for ρ can be determined by comparing ized using following formulas:
k
W TOC from NMR with W TOC from the pulsed neutron miner
alogy tool. Regarding formula 6.21, if the assumed value of EE
min
ρ is less than the real value, estimated K, V TOC , and conse E brittle E E (6.27)
k
quently W TOC from NMR would be less than the determined max min
value from the mineralogy log and vice versa. If the assumed max (6.28)
value of kerogen density is correct, then these two curves brittle
should provide similar results (Fig. 6.13). min max
The brittleness index (BI) is then defined as average of E
6.4.2.5 Determination of Brittleness Index Brittle shales and ν : brittle
are more likely to be naturally fractured and will also be more brittle
likely to respond well to hydraulic fracturing treatments. BI E brittle brittle 100 (6.29)
Rickman et al. (2008) and Grieser and Bray (2007) defined a sonic 2