
Page 259 - Fundamentals of Gas Shale Reservoirs
P. 259
INTEGRATING, INTERPRETING, AND USING PASSIVE SEISMIC DATA 239
components of the two sets are 90%/10% for the extensional observed, indicating that the subhorizontal nodal planes
focal mechanisms and 99%/1% for the wrench faulting focal from the normal faulting solutions are auxiliary planes and
mechanisms. This suggests a higher level of complexity for not fault planes.
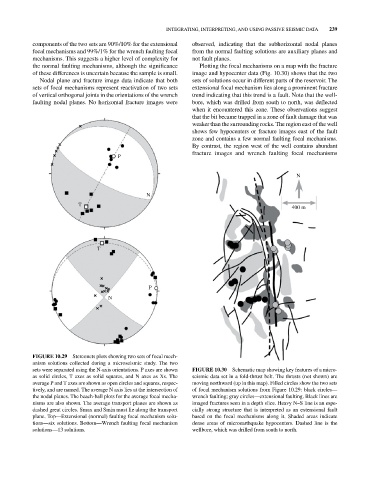
the normal faulting mechanisms, although the significance Plotting the focal mechanisms on a map with the fracture
of these differences is uncertain because the sample is small. image and hypocenter data (Fig. 10.30) shows that the two
Nodal plane and fracture image data indicate that both sets of solutions occur in different parts of the reservoir. The
sets of focal mechanisms represent reactivation of two sets extensional focal mechanism lies along a prominent fracture
of vertical orthogonal joints in the orientations of the wrench trend indicating that this trend is a fault. Note that the well
faulting nodal planes. No horizontal fracture images were bore, which was drilled from south to north, was deflected
when it encountered this zone. These observations suggest
that the bit became trapped in a zone of fault damage that was
weaker than the surrounding rocks. The region east of the well
shows few hypocenters or fracture images east of the fault
zone and contains a few normal faulting focal mechanisms.
By contrast, the region west of the well contains abundant
fracture images and wrench faulting focal mechanisms
P
N
N
T 400 m
T
P
N
FIGURE 10.29 Stereonets plots showing two sets of focal mech
anism solutions collected during a microseismic study. The two
sets were separated using the N‐axis orientations. P axes are shown FIGURE 10.30 Schematic map showing key features of a micro
as solid circles, T axes as solid squares, and N axes as Xs. The seismic data set in a fold‐thrust belt. The thrusts (not shown) are
average P and T axes are shown as open circles and squares, respec moving northward (up in this map). Filled circles show the two sets
tively, and are named. The average N axis lies at the intersection of of focal mechanism solutions from Figure 10.29: black circles—
the nodal planes. The beach‐ball plots for the average focal mecha wrench faulting; gray circles—extensional faulting. Black lines are
nisms are also shown. The average transport planes are shown as imaged fractures seen in a depth slice. Heavy N–S line is an espe
dashed great circles. Smax and Smin must lie along the transport cially strong structure that is interpreted as an extensional fault
plane. Top—Extensional (normal) faulting focal mechanism solu based on the focal mechanisms along it. Shaded areas indicate
tions—six solutions. Bottom—Wrench faulting focal mechanism dense areas of microearthquake hypocenters. Dashed line is the
solutions—13 solutions. wellbore, which was drilled from south to north.