
Page 254 - Fundamentals of Gas Shale Reservoirs
P. 254
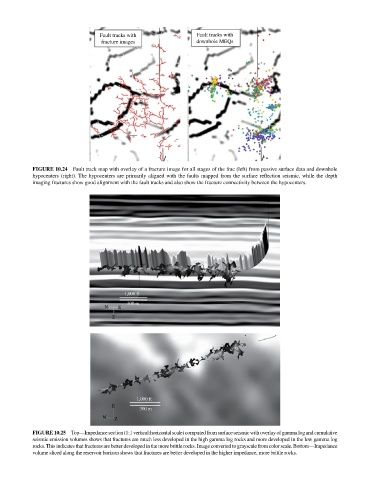
Fault tracks with               Fault tracks with
                                   fracture images                downhole MEQs


            FIGURE 10.24  Fault track map with overlay of a fracture image for all stages of the frac (left) from passive surface data and downhole
            hypocenters (right). The hypocenters are primarily aligned with the faults mapped from the surface reflection seismic, while the depth
            imaging fractures show good alignment with the fault tracks and also show the fracture connectivity between the hypocenters.


                                          1,000 ft
                                           300 m
                                    N   E
                                      Z


                                              1,000 ft
                                      E
                                               300 m
                                   N   Z

            FIGURE 10.25  Top—Impedance section (1:1 vertical:horizontal scale) computed from surface seismic with overlay of gamma log and cumulative
            seismic emission volumes shows that fractures are much less developed in the high gamma log rocks and more developed in the low gamma log
            rocks. This indicates that fractures are better developed in the more brittle rocks. Image converted to grayscale from color scale. Bottom—Impedance
            volume sliced along the reservoir horizon shows that fractures are better developed in the higher impedance, more brittle rocks.