
Page 258 - Fundamentals of Gas Shale Reservoirs
P. 258
238 PASSIVE SEISMIC METHODS FOR UNCONVENTIONAL RESOURCE DEVELOPMENT
represent strike‐slip faulting along N–S or E–W striking variability. The summation and subsequent decomposition
nodal planes, with NE–SW trending P axes (Figure 10.13). of the moment tensors of the events yield the best DC
The N–S striking nodal plane is consistent with the orienta mechanism shown as inset in the upper right corner of
tion of one of the three sets of fracture segments represented Figure 10.28. The DC component of the composite moment
in the circular histogram shown in Figure 10.27, suggest tensor is only about 20%, whereas the CLVD component
ing that this nodal plane represents the fault plane. The reaches 80%. The inferred seismic consistency of 0.25 is
histogram was constructed from fracture images as obviously very low. The high CLVD component is the
described in Section 10.5.5. Four events are of dip‐slip type consequence of the complexity of the fracture network as
(Figure 10.27). One event shows a strike‐slip mechanism inferred from the changes in the orientation of the nodal
with NW–SE trending P axis (Figure 10.27). The moment planes. The large variability in terms of focal mechanism
tensors of the 38 individual events are summed to form the type, and hence stress field, results in the observed low
composite moment tensor of the group. The decomposition seismic consistency.
of the composite moment tensor yields a DC and a CLVD The measure of fracture complexity and stress field vari
component of about 96% and 4%, respectively. The best ability discussed in this study may be used to infer implica
DC mechanism of the composite tensor is shown in tions for well placement and production as well as to develop
Figure 10.27. The seismic consistency for the study volume strategies for field management.
is estimated to be 0.77. The observed small CLVD compo
nent results from the predominance of strike‐slip mecha An Example of Stress and Natural Fracture Compart-
nisms and especially the N–S oriented fault planes. This mentalization Figures 10.29 and 10.30, respectively, show
predominance is confirmed by the best DC mechanism of two sets of MEQ focal mechanisms and a summary map of
the composite moment tensor shown in Figure 10.27. microseismic results from a surface‐based microseismic study
Although, as mentioned earlier, the group of focal mecha in an active fold‐thrust belt.
nisms described here are mostly of strike‐slip type with NE– The two sets represent MEQs produced by fracture
SW trending P axes, the presence of few dip‐slip events and treatment of a single horizontal well. They were sorted
a strike‐slip MEQ with NW–SE trending P axis was easily using the N‐axis orientations, which show less scatter
sufficient to lower the seismic consistency for the study than the P and T axes orientations (as is often the case, see
volume to 0.77. Section 10.3.2.2). Note that the N axes are horizontal for the
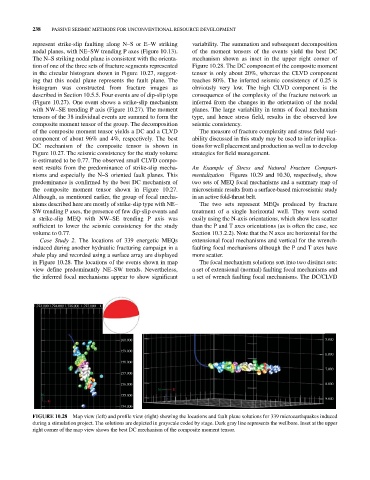
Case Study 2. The locations of 339 energetic MEQs extensional focal mechanisms and vertical for the wrench‐
induced during another hydraulic fracturing campaign in a faulting focal mechanisms although the P and T axes have
shale play and recorded using a surface array are displayed more scatter.
in Figure 10.28. The locations of the events shown in map The focal mechanism solutions sort into two distinct sets:
view define predominantly NE–SW trends. Nevertheless, a set of extensional (normal) faulting focal mechanisms and
the inferred focal mechanisms appear to show significant a set of wrench faulting focal mechanisms. The DC/CLVD
1.723.000 1.724.000 1.726.000 1.727.000 1.
160.000 5.000
159.000
6.000
158.000
7.000
157.000
156.000 8.000
N E
N 155.000
E Z 9.000
154.000
FIGURE 10.28 Map view (left) and profile view (right) showing the locations and fault plane solutions for 339 microearthquakes induced
during a stimulation project. The solutions are depicted in grayscale coded by stage. Dark gray line represents the wellbore. Inset at the upper
right corner of the map view shows the best DC mechanism of the composite moment tensor.