
Page 253 - Fundamentals of Gas Shale Reservoirs
P. 253
MONITORING PASSIVE SEISMIC EMISSIONS WITH SURFACE AND SHALLOW BURIED ARRAYS 233
E N
Z
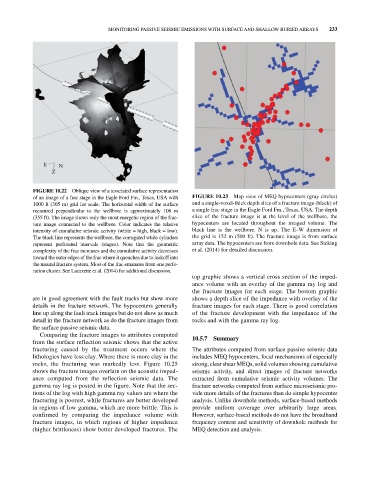
FIGURE 10.22 Oblique view of a tesselated surface representation
of an image of a frac stage in the Eagle Ford Fm., Texas, USA with FIGURE 10.23 Map view of MEQ hypocenters (gray circles)
1000 ft (305 m) grid for scale. The horizontal width of the surface and a single‐voxel‐thick depth slice of a fracture image (black) of
measured perpendicular to the wellbore is approximately 108 m a single frac stage in the Eagle Ford Fm., Texas, USA. The depth
(355 ft). The image shows only the most energetic region of the frac slice of the fracture image is at the level of the wellbore, the
ture image connected to the wellbore. Color indicates the relative hypocenters are located throughout the imaged volume. The
intensity of cumulative seismic activity (white = high, black = low). black line is the wellbore. N is up. The E–W dimension of
The black line represents the wellbore, the corrugated white cylinders the grid is 152 m (500 ft). The fracture image is from surface
represent perforated intervals (stages). Note that the geometric array data. The hypocenters are from downhole data. See Sicking
complexity of the frac increases and the cumulative activity decreases et al. (2014) for detailed discussion.
toward the outer edges of the frac where it quenches due to leakoff into
the natural fracture system. Most of the frac emanates from one perfo
ration cluster. See Lacazette et al. (2014) for additional discussion.
top graphic shows a vertical cross section of the imped
ance volume with an overlay of the gamma ray log and
the fracture images for each stage. The bottom graphic
are in good agreement with the fault tracks but show more shows a depth slice of the impedance with overlay of the
details in the fracture network. The hypocenters generally fracture images for each stage. There is good correlation
line up along the fault track images but do not show as much of the fracture development with the impedance of the
detail in the fracture network as do the fracture images from rocks and with the gamma ray log.
the surface passive seismic data.
Comparing the fracture images to attributes computed
from the surface reflection seismic shows that the active 10.5.7 Summary
fracturing caused by the treatment occurs where the The attributes computed from surface passive seismic data
lithologies have less clay. Where there is more clay in the includes MEQ hypocenters, focal mechanisms of especially
rocks, the fracturing was markedly less. Figure 10.25 strong, clear shear MEQs, solid volumes showing cumulative
shows the fracture images overlain on the acoustic imped seismic activity, and direct images of fracture networks
ance computed from the reflection seismic data. The extracted from cumulative seismic activity volumes. The
gamma ray log is posted in the figure. Note that the sec fracture networks computed from surface microseismic pro
tions of the log with high gamma ray values are where the vide more details of the fractures than do simple hypocenter
fracturing is poorest, while fractures are better developed analysis. Unlike downhole methods, surface‐based methods
in regions of low gamma, which are more brittle. This is provide uniform coverage over arbitrarily large areas.
confirmed by comparing the impedance volume with However, surface‐based methods do not have the broadband
fracture images, in which regions of higher impedence frequency content and sensitivity of downhole methods for
(higher brittleness) show better developed fractures. The MEQ detection and analysis.