
Page 249 - Fundamentals of Gas Shale Reservoirs
P. 249
MONITORING PASSIVE SEISMIC EMISSIONS WITH SURFACE AND SHALLOW BURIED ARRAYS 229
Crossline Crossline
1 250 1 250
1 200
1 200
1 150 1 150
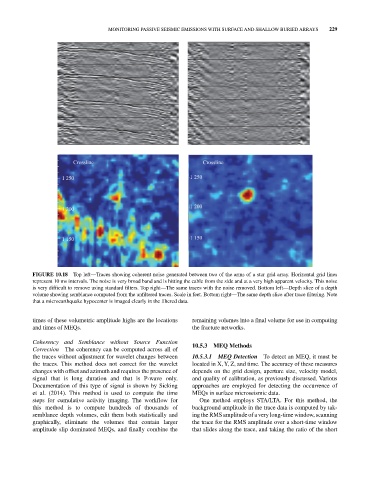
FIGURE 10.18 Top left—Traces showing coherent noise generated between two of the arms of a star grid array. Horizontal grid lines
represent 10 ms intervals. The noise is very broad band and is hitting the cable from the side and at a very high apparent velocity. This noise
is very difficult to remove using standard filters. Top right—The same traces with the noise removed. Bottom left—Depth slice of a depth
volume showing semblance computed from the unfiltered traces. Scale in feet. Bottom right—The same depth slice after trace filtering. Note
that a microearthquake hypocenter is imaged clearly in the filtered data.
times of these volumetric amplitude highs are the locations remaining volumes into a final volume for use in computing
and times of MEQs. the fracture networks.
Coherency and Semblance without Source Function 10.5.3 MEQ Methods
Correction The coherency can be computed across all of
the traces without adjustment for wavelet changes between 10.5.3.1 MEQ Detection To detect an MEQ, it must be
the traces. This method does not correct for the wavelet located in X, Y, Z, and time. The accuracy of these measures
changes with offset and azimuth and requires the presence of depends on the grid design, aperture size, velocity model,
signal that is long duration and that is P‐wave only. and quality of calibration, as previously discussed. Various
Documentation of this type of signal is shown by Sicking approaches are employed for detecting the occurrence of
et al. (2014). This method is used to compute the time MEQs in surface microseismic data.
steps for cumulative activity imaging. The workflow for One method employs STA/LTA. For this method, the
this method is to compute hundreds of thousands of background amplitude in the trace data is computed by tak
semblance depth volumes, edit them both statistically and ing the RMS amplitude of a very long‐time window, scanning
graphically, eliminate the volumes that contain larger the trace for the RMS amplitude over a short‐time window
amplitude slip dominated MEQs, and finally combine the that slides along the trace, and taking the ratio of the short