
Page 250 - Fundamentals of Gas Shale Reservoirs
P. 250
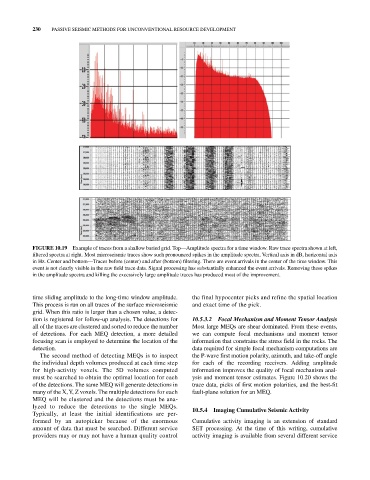
230 PASSIVE SEISMIC METHODS FOR UNCONVENTIONAL RESOURCE DEVELOPMENT
FIGURE 10.19 Example of traces from a shallow buried grid. Top—Amplitude spectra for a time window. Raw trace spectra shown at left,
filtered spectra at right. Most microseismic traces show such pronounced spikes in the amplitude spectra. Vertical axis in dB, horizontal axis
in Hz. Center and bottom—Traces before (center) and after (bottom) filtering. There are event arrivals in the center of the time window. This
event is not clearly visible in the raw field trace data. Signal processing has substantially enhanced the event arrivals. Removing these spikes
in the amplitude spectra and killing the excessively large amplitude traces has produced most of the improvement.
time sliding amplitude to the long‐time window amplitude. the final hypocenter picks and refine the spatial location
This process is run on all traces of the surface microseismic and exact time of the pick.
grid. When this ratio is larger than a chosen value, a detec
tion is registered for follow‐up analysis. The detections for 10.5.3.2 Focal Mechanism and Moment Tensor Analysis
all of the traces are clustered and sorted to reduce the number Most large MEQs are shear dominated. From these events,
of detections. For each MEQ detection, a more detailed we can compute focal mechanisms and moment tensor
focusing scan is employed to determine the location of the information that constrains the stress field in the rocks. The
detection. data required for simple focal mechanism computations are
The second method of detecting MEQs is to inspect the P‐wave first motion polarity, azimuth, and take‐off angle
the individual depth volumes produced at each time step for each of the recording receivers. Adding amplitude
for high‐activity voxels. The 5D volumes computed information improves the quality of focal mechanism anal
must be searched to obtain the optimal location for each ysis and moment tensor estimates. Figure 10.20 shows the
of the detections. The same MEQ will generate detections in trace data, picks of first motion polarities, and the best‐fit
many of the X, Y, Z voxels. The multiple detections for each fault‐plane solution for an MEQ.
MEQ will be clustered and the detections must be ana
lyzed to reduce the detections to the single MEQs. 10.5.4 Imaging Cumulative Seismic Activity
Typically, at least the initial identifications are per
formed by an autopicker because of the enormous Cumulative activity imaging is an extension of standard
amount of data that must be searched. Different service SET processing. At the time of this writing, cumulative
providers may or may not have a human quality control activity imaging is available from several different service