
Page 246 - Fundamentals of Gas Shale Reservoirs
P. 246
226 PASSIVE SEISMIC METHODS FOR UNCONVENTIONAL RESOURCE DEVELOPMENT
of total receiver statics that will move the receivers to a with eight or more arms radiating outward from the well
constant flat datum. Using this total receiver static, a proper head. The star design is good for removing surface waves
static for each receiver can be obtained that will allow propagating out from the well head. However, normally
improved flattening in microseismic focusing. there are many other surface wave noise sources so that the
coherent surface wave noise cannot be removed adequately
10.5.2.6 Grid Design The design of the grid for recording because of poor azimuth control. This grid design also suf
the passive data is important for detection and accurate fers from poor sampling toward the ends of the arms. Other
location of both MEQ and fracture networks. Overall, the grid designs that use lines of receivers include parallel lines
optimum grid design is as uniform a distribution of geophones of receivers and orthogonal grids of receiver lines, both of
as possible that covers the required aperture. The most uni which work quite well.
form distribution is a face‐centered hexagonal closest packed Buried grids normally will not have strong coherent sur
grid, which is only possible with a nodal recording system. face wave noise because the geophones are below the depth
For good‐quality imaging, a radial aperture of 1.5 or even of surface waves. This allows the density of the receivers in
1.6 times target depth is a good rule of thumb. In other the grid to be much smaller than for surface array grids.
words, the outer edge of the array should ideally be 1.5 times Surface grids must have many more receivers than buried
depth perpendicularly outward from the bottom edge of the grids in order to predict and remove coherent surface wave
subsurface image volume. Areas with fast velocity require noise. Prediction is accomplished by modeling noise as it
larger aperture, while areas of slower velocity require smaller propagates across the grid. The number of receivers
aperture. The optimum method for determining the required required for surface grids is a factor of 10 higher than for
aperture is to use ray tracing and the velocity model for the buried grids.
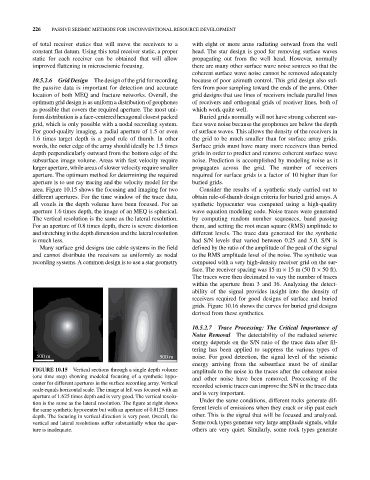
area. Figure 10.15 shows the focusing and imaging for two Consider the results of a synthetic study carried out to
different apertures. For the time window of the trace data, obtain rule‐of‐thumb design criteria for buried grid arrays. A
all voxels in the depth volume have been focused. For an synthetic hypocenter was computed using a high‐quality
aperture 1.6 times depth, the image of an MEQ is spherical. wave equation modeling code. Noise traces were generated
The vertical resolution is the same as the lateral resolution. by computing random number sequences, band passing
For an aperture of 0.8 times depth, there is severe distortion them, and setting the root mean square (RMS) amplitude to
and stretching in the depth dimension and the lateral resolution different levels. The trace data generated for the synthetic
is much less. had S/N levels that varied between 0.25 and 5.0. S/N is
Many surface grid designs use cable systems in the field defined by the ratio of the amplitude of the peak of the signal
and cannot distribute the receivers as uniformly as nodal to the RMS amplitude level of the noise. The synthetic was
recording systems. A common design is to use a star geometry computed with a very high‐density receiver grid on the sur
face. The receiver spacing was 15 m × 15 m (50 ft × 50 ft).
The traces were then decimated to vary the number of traces
within the aperture from 3 and 36. Analyzing the detect
ability of the signal provides insight into the density of
receivers required for good designs of surface and buried
grids. Figure 10.16 shows the curves for buried grid designs
derived from these synthetics.
10.5.2.7 Trace Processing: The Critical Importance of
Noise Removal The detectability of the radiated seismic
energy depends on the S/N ratio of the trace data after fil
tering has been applied to suppress the various types of
500 m 500 m noise. For good detection, the signal level of the seismic
energy arriving from the subsurface must be of similar
FIGURE 10.15 Vertical sections through a single depth volume amplitude to the noise in the traces after the coherent noise
(one time step) showing modeled focusing of a synthetic hypo and other noise have been removed. Processing of the
center for different apertures in the surface recording array. Vertical recorded seismic traces can improve the S/N in the trace data
scale equals horizontal scale. The image at left was focused with an and is very important.
aperture of 1.625 times depth and is very good. The vertical resolu
tion is the same as the lateral resolution. The figure at right shows Under the same conditions, different rocks generate dif
the same synthetic hypocenter but with an aperture of 0.8125 times ferent levels of emissions when they crack or slip past each
depth. The focusing in vertical direction is very poor. Overall, the other. This is the signal that will be focused and analyzed.
vertical and lateral resolutions suffer substantially when the aper Some rock types generate very large amplitude signals, while
ture is inadequate. others are very quiet. Similarly, some rock types generate