
Page 241 - Fundamentals of Gas Shale Reservoirs
P. 241
MICROSEISMIC DOWNHOLE MONITORING 221
(a) (b)
Frequency (Hz) Frequency (Hz)
0 500 1000 1500 0 500 1000 1500
0 0
–20
–20
Decibel (dB) Decibel (dB)
–40
–40
–60
–60 P wave S wave
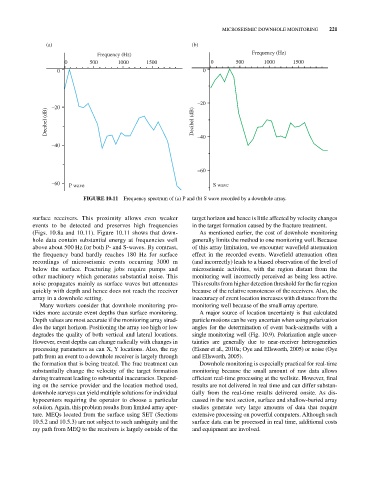
FIGURE 10.11 Frequency spectrum of (a) P and (b) S wave recorded by a downhole array.
surface receivers. This proximity allows even weaker target horizon and hence is little affected by velocity changes
events to be detected and preserves high frequencies in the target formation caused by the fracture treatment.
(Figs. 10.8a and 10.11). Figure 10.11 shows that down As mentioned earlier, the cost of downhole monitoring
hole data contain substantial energy at frequencies well generally limits the method to one monitoring well. Because
above about 500 Hz for both P‐ and S‐waves. By contrast, of this array limitation, we encounter wavefield attenuation
the frequency band hardly reaches 180 Hz for surface effect in the recorded events. Wavefield attenuation often
recordings of microseismic events occurring 3000 m (and incorrectly) leads to a biased observation of the level of
below the surface. Fracturing jobs require pumps and microseismic activities, with the region distant from the
other machinery which generates substantial noise. This monitoring well incorrectly perceived as being less active.
noise propagates mainly as surface waves but attenuates This results from higher detection threshold for the far region
quickly with depth and hence does not reach the receiver because of the relative remoteness of the receivers. Also, the
array in a downhole setting. inaccuracy of event location increases with distance from the
Many workers consider that downhole monitoring pro monitoring well because of the small array aperture.
vides more accurate event depths than surface monitoring. A major source of location uncertainty is that calculated
Depth values are most accurate if the monitoring array strad particle motions can be very uncertain when using polarization
dles the target horizon. Positioning the array too high or low angles for the determination of event back‐ azimuths with a
degrades the quality of both vertical and lateral locations. single monitoring well (Fig. 10.9). Polarization angle uncer
However, event depths can change radically with changes in tainties are generally due to near‐receiver heterogeneities
processing parameters as can X, Y locations. Also, the ray (Eisner et al., 2010a; Oye and Ellsworth, 2005) or noise (Oye
path from an event to a downhole receiver is largely through and Ellsworth, 2005).
the formation that is being treated. The frac treatment can Downhole monitoring is especially practical for real‐time
substantially change the velocity of the target formation monitoring because the small amount of raw data allows
during treatment leading to substantial inaccuracies. Depend efficient real‐time processing at the wellsite. However, final
ing on the service provider and the location method used, results are not delivered in real time and can differ substan
downhole surveys can yield multiple solutions for individual tially from the real‐time results delivered onsite. As dis
hypocenters requiring the operator to choose a particular cussed in the next section, surface and shallow‐buried array
solution. Again, this problem results from limited array aper studies generate very large amounts of data that require
ture. MEQs located from the surface using SET (Sections extensive processing on powerful computers. Although such
10.5.2 and 10.5.3) are not subject to such ambiguity and the surface data can be processed in real time, additional costs
ray path from MEQ to the receivers is largely outside of the and equipment are involved.