
Page 240 - Fundamentals of Gas Shale Reservoirs
P. 240
220 PASSIVE SEISMIC METHODS FOR UNCONVENTIONAL RESOURCE DEVELOPMENT
1.652.000 1.653.000 1.654.000 1.655.000 1.656.000 1.657.000
289.000
288.500
288.000
287.500
287.000
286.500
286.000
285.500
2.500
285.000
3.000
284.500
3.500
284.000 4.000
N E
283.500 4.500
N
–500 Z
E
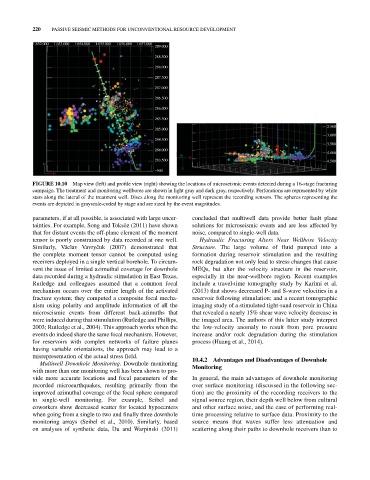
FIGURE 10.10 Map view (left) and profile view (right) showing the locations of microseismic events detected during a 16‐stage fracturing
campaign. The treatment and monitoring wellbores are shown in light gray and dark gray, respectively. Perforations are represented by white
stars along the lateral of the treatment well. Discs along the monitoring well represent the recording sensors. The spheres representing the
events are depicted in grayscale‐coded by stage and are sized by the event magnitudes.
parameters, if at all possible, is associated with large uncer concluded that multiwell data provide better fault plane
tainties. For example, Song and Toksöz (2011) have shown solutions for microseismic events and are less affected by
that for distant events the off‐plane element of the moment noise, compared to single‐well data.
tensor is poorly constrained by data recorded at one well. Hydraulic Fracturing Alters Near Wellbore Velocity
Similarly, Václav Vavryčuk (2007) demonstrated that Structure. The large volume of fluid pumped into a
the complete moment tensor cannot be computed using formation during reservoir stimulation and the resulting
receivers deployed in a single vertical borehole. To circum rock degradation not only lead to stress changes that cause
vent the issue of limited azimuthal coverage for downhole MEQs, but alter the velocity structure in the reservoir,
data recorded during a hydraulic stimulation in East Texas, especially in the near‐wellbore region. Recent examples
Rutledge and colleagues assumed that a common focal include a travel‐time tomography study by Karimi et al.
mechanism occurs over the entire length of the activated (2013) that shows decreased P‐ and S‐wave velocities in a
fracture system; they computed a composite focal mecha reservoir following stimulation; and a recent tomographic
nism using polarity and amplitude information of all the imaging study of a stimulated tight‐sand reservoir in China
microseismic events from different back‐azimuths that that revealed a nearly 15% shear wave velocity decrease in
were induced during that stimulation (Rutledge and Phillips, the imaged area. The authors of this latter study interpret
2003; Rutledge et al., 2004). This approach works when the the low‐velocity anomaly to result from pore pressure
events do indeed share the same focal mechanism. However, increase and/or rock degradation during the stimulation
for reservoirs with complex networks of failure planes process (Huang et al., 2014).
having variable orientations, the approach may lead to a
misrepresentation of the actual stress field. 10.4.2 Advantages and Disadvantages of Downhole
Multiwell Downhole Monitoring. Downhole monitoring
with more than one monitoring well has been shown to pro Monitoring
vide more accurate locations and focal parameters of the In general, the main advantages of downhole monitoring
recorded microearthquakes, resulting primarily from the over surface monitoring (discussed in the following sec
improved azimuthal coverage of the focal sphere compared tion) are the proximity of the recording receivers to the
to single‐well monitoring. For example, Seibel and signal source region, their depth well below from cultural
coworkers show decreased scatter for located hypocenters and other surface noise, and the ease of performing real‐
when going from a single to two and finally three downhole time processing relative to surface data. Proximity to the
monitoring arrays (Seibel et al., 2010). Similarly, based source means that waves suffer less attenuation and
on analyses of synthetic data, Du and Warpinski (2011) scattering along their paths to downhole receivers than to