
Page 304 - Fundamentals of Gas Shale Reservoirs
P. 304
284 PERFORMANCE ANALYSIS OF UNCONVENTIONAL SHALE RESERVOIRS
matrix to micro and macro fractures. Hydrocarbon‐rich shale
reservoirs are typically oil wet while their counterparts, tight
sandstones, are generally water wet.
Shale reservoirs are classified based on whether the
hydrocarbon source is an integral part of the reservoir rock
fabric (self‐sourced, as in Haynesville), or is adjacent to the
reservoir (locally sourced, as in Bakken), or is located at
large distances from the reservoir and require significant
hydrocarbon migration (externally sourced, as in Austin
Chalk) (Tepper et al., 2013). The self‐sourcing is the
prominent, distinguishing feature of the low‐permeability
shale reservoirs compared to the externally sourced, low‐
permeability sandstone reservoirs.
Shale reservoirs have very low permeability and porosity.
A typical shale reservoir has a very low permeability matrix
2
5
of about 10 to 10 mD and a porosity of less than 10%.
Shale reservoirs must be stimulated to produce commercial
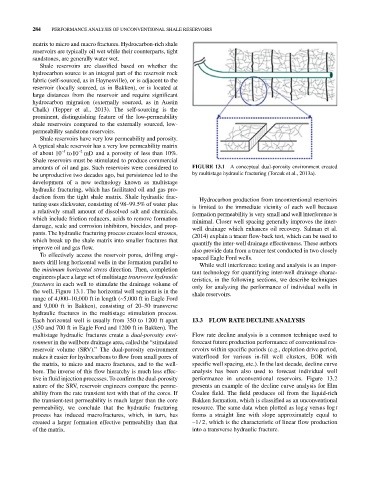
amounts of oil and gas. Such reservoirs were considered to FIgURE 13.1 A conceptual dual‐porosity environment created
be unproductive two decades ago, but persistence led to the by multistage hydraulic fracturing (Torcuk et al., 2013a).
development of a new technology known as multistage
hydraulic fracturing, which has facilitated oil and gas pro-
duction from the tight shale matrix. Shale hydraulic frac- Hydrocarbon production from unconventional reservoirs
turing uses slickwater, consisting of 98–99.5% of water plus is limited to the immediate vicinity of each well because
a relatively small amount of dissolved salt and chemicals, formation permeability is very small and well interference is
which include friction reducers, acids to remove formation minimal. Closer well spacing generally improves the inter‐
damage, scale and corrosion inhibitors, biocides, and prop- well drainage which enhances oil recovery. Salman et al.
pants. The hydraulic fracturing process creates local stresses, (2014) explain a tracer flow‐back test, which can be used to
which break up the shale matrix into smaller fractures that quantify the inter‐well drainage effectiveness. These authors
improve oil and gas flow. also provide data from a tracer test conducted in two closely
To effectively access the reservoir pores, drilling engi- spaced Eagle Ford wells.
neers drill long horizontal wells in the formation parallel to While well interference testing and analysis is an impor-
the minimum horizontal stress direction. Then, completion tant technology for quantifying inter‐well drainage charac-
engineers place a large set of multistage transverse hydraulic teristics, in the following sections, we describe techniques
fractures in each well to stimulate the drainage volume of only for analyzing the performance of individual wells in
the well, Figure 13.1. The horizontal well segment is in the shale reservoirs.
range of 4,000–10,000 ft in length (~5,000 ft in Eagle Ford
and 9,000 ft in Bakken), consisting of 20–50 transverse
hydraulic fractures in the multistage stimulation process.
Each horizontal well is usually from 350 to 1200 ft apart 13.3 FLOW RATE DECLINE ANALYSIS
(350 and 700 ft in Eagle Ford and 1200 ft in Bakken). The
multistage hydraulic fractures create a dual‐porosity envi- Flow rate decline analysis is a common technique used to
ronment in the wellbore drainage area, called the “stimulated forecast future production performance of conventional res-
reservoir volume (SRV).” The dual‐porosity environment ervoirs within specific periods (e.g., depletion drive period,
makes it easier for hydrocarbons to flow from small pores of waterflood for various in‐fill well clusters, EOR with
the matrix, to micro and macro fractures, and to the well- specific well spacing, etc.). In the last decade, decline curve
bore. The inverse of this flow hierarchy is much less effec- analysis has been also used to forecast individual well
tive in fluid injection processes. To confirm the dual‐porosity performance in unconventional reservoirs. Figure 13.2
nature of the SRV, reservoir engineers compare the perme- presents an example of the decline curve analysis for Elm
ability from the rate transient test with that of the cores. If Coulee field. The field produces oil from the liquid‐rich
the transient‐test permeability is much larger than the core Bakken formation, which is classified as an unconventional
permeability, we conclude that the hydraulic fracturing resource. The same data when plotted as log q versus log t
process has induced macrofractures, which, in turn, has forms a straight line with slope approximately equal to
created a larger formation effective permeability than that 12, which is the characteristic of linear flow production
/
of the matrix. into a transverse hydraulic fracture.