
Page 348 - Fundamentals of Gas Shale Reservoirs
P. 348
328 MOLECULAR SIMULATION OF GAS ADSORPTION IN MINERALS AND COAL
TAbLE 15.1 Summary of various simulations performed
Adsorbent phase Surface area (Å) Layer interval (Å) Temperature (K) Pressure (MPa) Moist content Gas composition
Quartz 24.55 × 27.01 10, 15, 20 310 0–15 Dry Natural gas b
Wyoming‐type a 31.68 × 27.42 20 353.5 5–30 Dry, 7 wt% Natural gas b
Zeolite (FAU) — — 288, 308, 328 1–100 Dry CH , CO 2
4
Coal — — 308, 370 0–10 Dry, 1.2%, 3% CH
4
a Montmorillonite.
b 92% CH , 6% C H , and 2% C H . 8
4
3
2
6
Zeolite (FAU) simulation cell: 25.099 × 25.099 × 25.099 Å . 3
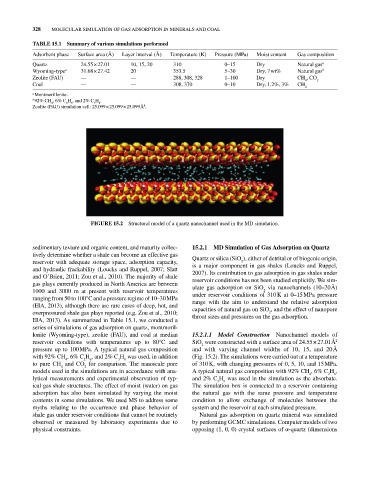
FIGURE 15.2 Structural model of a quartz nanochannel used in the MD simulation.
sedimentary texture and organic content, and maturity collec 15.2.1 MD Simulation of Gas Adsorption on Quartz
tively determine whether a shale can become an effective gas Quartz or silica (SiO ), either of detrital or of biogenic origin,
reservoir with adequate storage space, adsorption capacity, is a major component in gas shales (Loucks and Ruppel,
2
and hydraulic frackability (Loucks and Ruppel, 2007; Slatt 2007). Its contribution to gas adsorption in gas shales under
and O’Brien, 2011; Zou et al., 2010). The majority of shale reservoir conditions has not been studied explicitly. We sim
gas plays currently produced in North America are between ulate gas adsorption on SiO via nanochannels (10–20 Å)
1000 and 3000 m at present with reservoir temperatures under reservoir conditions of 310 K at 0–15 MPa pressure
2
ranging from 50 to 100°C and a pressure regime of 10–30 MPa range with the aim to understand the relative adsorption
(EIA, 2013), although there are rare cases of deep, hot, and capacities of natural gas on SiO , and the effect of nanopore
overpressured shale gas plays reported (e.g. Zou et al., 2010; throat sizes and pressures on the gas adsorption.
2
EIA, 2013). As summarized in Table 15.1, we conducted a
series of simulations of gas adsorption on quartz, montmoril
lonite (Wyoming‐type), zeolite (FAU), and coal at median 15.2.1.1 Model Construction Nanochannel models of
reservoir conditions with temperatures up to 80°C and SiO were constructed with a surface area of 24.55 × 27.01 Å
2
2
pressure up to 100 MPa. A typical natural gas composition and with varying channel widths of 10, 15, and 20 Å
with 92% CH , 6% C H , and 2% C H was used, in addition (Fig. 15.2). The simulations were carried out at a temperature
2
6
3
4
8
to pure CH and CO for comparison. The nanoscale pore of 310 K, with changing pressures of 0, 5, 10, and 15 MPa.
4
2
models used in the simulations are in accordance with ana A typical natural gas composition with 92% CH , 6% C H ,
6
2
4
lytical measurements and experimental observation of typ and 2% C H was used in the simulation as the absorbate.
3
8
ical gas shale structures. The effect of moist (water) on gas The simulation box is connected to a reservoir containing
adsorption has also been simulated by varying the moist the natural gas with the same pressure and temperature
contents in some simulations. We used MS to address some condition to allow exchange of molecules between the
myths relating to the occurrence and phase behavior of system and the reservoir at each simulated pressure.
shale gas under reservoir conditions that cannot be routinely Natural gas adsorption on quartz mineral was simulated
observed or measured by laboratory experiments due to by performing GCMC simulations. Computer models of two
physical constraints. opposing (1, 0, 0) crystal surfaces of α‐quartz (dimensions