
Page 349 - Fundamentals of Gas Shale Reservoirs
P. 349
MS OF GAS ADSORPTION ON MINERALS 329
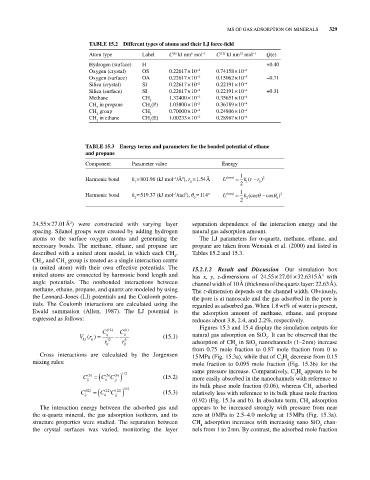
TAbLE 15.2 Different types of atoms and their LJ force‐field
(12)
Atom type Label C kJ nm mol −1 C kJ nm mol −1 Q(e)
(6)
12
6
Hydrogen (surface) H +0.40
Oxygen (crystal) OS 0.22617 × 10 −2 0.74158 × 10 −6
Oxygen (surface) OA 0.22617 × 10 −2 0.15062 × 10 −5 −0.71
Silica (crystal) SI 0.22617 × 10 −2 0.22191 × 10 −4
Silica (surface) SI 0.22617 × 10 −2 0.22191 × 10 −4 +0.31
Methane CH 4 1.32400 × 10 −2 0.35651 × 10 −4
CH in propane CH (P) 1.03800 × 10 −2 0.36789 × 10 −4
3
3
CH group CH 2 0.70000 × 10 −2 0.24806 × 10 −4
2
CH in ethane CH (E) 1.00233 × 10 −2 0.28987 × 10 −4
3 3
TAbLE 15.3 Energy terms and parameters for the bonded potential of ethane
and propane
Component Parameter value Energy
1
Harmonic bond k = 801.96 (kJ mol /Å ), r = 1.54 Å U bond k rr ) 2
(
−1
2
0
1
1
0
2
Harmonic bond k = 519.37 (kJ mol /rad ), θ = 114° U bond 1 k cos cos ) 2
2
(
−1
2 0 2 2 0
2
24.55 × 27.01 Å ) were constructed with varying layer separation dependence of the interaction energy and the
spacing. Silanol groups were created by adding hydrogen natural gas adsorption amount.
atoms to the surface oxygen atoms and generating the The LJ parameters for α‐quartz, methane, ethane, and
necessary bonds. The methane, ethane, and propane are propane are taken from Wensink et al. (2000) and listed in
described with a united atom model, in which each CH , Tables 15.2 and 15.3.
4
CH , and CH group is treated as a single interaction centre
3
2
(a united atom) with their own effective potentials. The 15.2.1.2 Result and Discussion Our simulation box
united atoms are connected by harmonic bond length and has x, y, z‐dimensions of 24.55 × 27.01 × 32.6315 Å with
3
angle potentials. The nonbonded interactions between channel width of 10 Å (thickness of the quartz layer: 22.63 Å).
methane, ethane, propane, and quartz are modeled by using The z‐dimension depends on the channel width. Obviously,
the Lennard–Jones (LJ) potentials and the Coulomb poten the pore is at nanoscale and the gas adsorbed in the pore is
tials. The Coulomb interactions are calculated using the regarded as adsorbed gas. When 1.8 wt% of water is present,
Ewald summation (Allen, 1987). The LJ potential is the adsorption amount of methane, ethane, and propane
expressed as follows: reduces about 3.8, 2.4, and 2.2%, respectively.
Figures 15.3 and 15.4 display the simulation outputs for
6
C (12 ) C ()
Vr() ij ij (15.1) natural gas adsorption on SiO . It can be observed that the
2
LJ
ij
r ij 12 r ij 6 adsorption of CH in SiO nanochannels (1–2 nm) increase
2
4
from 0.75 mole fraction to 0.87 mole fraction from 0 to
Cross interactions are calculated by the Jorgensen 15 MPa (Fig. 15.3a), while that of C H decrease from 0.15
2
6
mixing rules: mole fraction to 0.095 mole fraction (Fig. 15.3b) for the
same pressure increase. Comparatively, C H appears to be
/ 12 2 6
6
6
C () C C () (15.2)
()
6
ij ii jj more easily absorbed in the nanochannels with reference to
its bulk phase mole fraction (0.06), whereas CH adsorbed
/ 12 4
C ij (12 ) C ii (12 ) C (12 ) (15.3) relatively less with reference to its bulk phase mole fraction
jj
(0.92) (Fig. 15.3a and b). In absolute term, CH adsorption
4
The interaction energy between the adsorbed gas and appears to be increased strongly with pressure from near
the α‐quartz mineral, the gas adsorption isotherm, and its zero at 0 MPa to 2.5–4.0 mole/kg at 15 MPa (Fig. 15.3a).
structure properties were studied. The separation between CH adsorption increases with increasing nano SiO chan
2
4
the crystal surfaces was varied, monitoring the layer nels from 1 to 2 nm. By contrast, the adsorbed mole fraction