
Page 354 - Fundamentals of Gas Shale Reservoirs
P. 354
334 MOLECULAR SIMULATION OF GAS ADSORPTION IN MINERALS AND COAL
O
C
A
X Z
Y
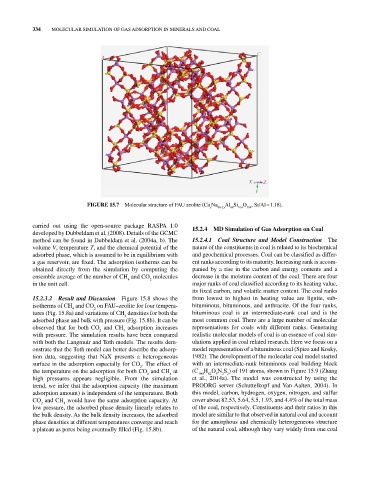
FIGURE 15.7 Molecular structure of FAU zeolite (Ca Na Al Si O , Si/Al = 1.18).
x 88‐2x 88 104 384
carried out using the open‐source package RASPA 1.0 15.2.4 MD Simulation of Gas Adsorption on Coal
developed by Dubbeldam et al. (2008). Details of the GCMC
method can be found in Dubbeldam et al. (2004a, b). The 15.2.4.1 Coal Structure and Model Construction The
volume V, temperature T, and the chemical potential of the nature of the constituents in coal is related to its biochemical
adsorbed phase, which is assumed to be in equilibrium with and geochemical processes. Coal can be classified as differ
a gas reservoir, are fixed. The adsorption isotherms can be ent ranks according to its maturity. Increasing rank is accom
obtained directly from the simulation by computing the panied by a rise in the carbon and energy contents and a
ensemble average of the number of CH and CO molecules decrease in the moisture content of the coal. There are four
2
4
in the unit cell. major ranks of coal classified according to its heating value,
its fixed carbon, and volatile matter content. The coal ranks
15.2.3.2 Result and Discussion Figure 15.8 shows the from lowest to highest in heating value are lignite, sub‐
isotherms of CH and CO on FAU–zeolite for four tempera bituminous, bituminous, and anthracite. Of the four ranks,
4
2
tures (Fig. 15.8a) and variations of CH densities for both the bituminous coal is an intermediate‐rank coal and is the
4
adsorbed phase and bulk with pressure (Fig. 15.8b). It can be most common coal. There are a large number of molecular
observed that for both CO and CH adsorption increases representations for coals with different ranks. Generating
4
2
with pressure. The simulation results have been compared realistic molecular models of coal is an essence of coal sim
with both the Langmuir and Toth models. The results dem ulations applied in coal related research. Here we focus on a
onstrate that the Toth model can better describe the adsorp model representation of a bituminous coal (Spiro and Kosky,
tion data, suggesting that NaX presents a heterogeneous 1982). The development of the molecular coal model started
surface in the adsorption especially for CO . The effect of with an intermediate‐rank bituminous coal building block
2
the temperature on the adsorption for both CO and CH at (C H O N S ) of 191 atoms, shown in Figure 15.9 (Zhang
100
2 2
82
5
4
2
high pressures appears negligible. From the simulation et al., 2014a). The model was constructed by using the
trend, we infer that the adsorption capacity (the maximum PRODRG server (Schuttelkopf and Van Aalten, 2004). In
adsorption amount) is independent of the temperature. Both this model, carbon, hydrogen, oxygen, nitrogen, and sulfur
CO and CH would have the same adsorption capacity. At cover about 82.53, 5.64, 5.5, 1.93, and 4.4% of the total mass
2
4
low pressure, the adsorbed phase density linearly relates to of the coal, respectively. Constituents and their ratios in this
the bulk density. As the bulk density increases, the adsorbed model are similar to that observed in natural coal and account
phase densities at different temperatures converge and reach for the amorphous and chemically heterogeneous structure
a plateau as pores being eventually filled (Fig. 15.8b). of the natural coal, although they vary widely from one coal