
Page 58 - Fundamentals of Geomorphology
P. 58
THE GEOMORPHIC SYSTEM 41
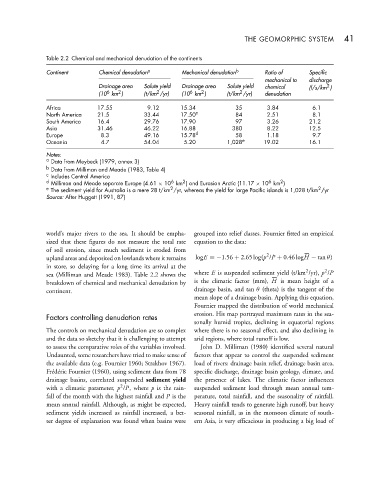
Table 2.2 Chemical and mechanical denudation of the continents
Continent Chemical denudation a Mechanical denudation b Ratio of Specific
mechanical to discharge
Drainage area Solute yield Drainage area Solute yield chemical (l/s/km )
2
6
6
2
2
2
2
(10 km ) (t/km /yr) (10 km ) (t/km /yr) denudation
Africa 17.55 9.12 15.34 35 3.84 6.1
North America 21.5 33.44 17.50 c 84 2.51 8.1
South America 16.4 29.76 17.90 97 3.26 21.2
Asia 31.46 46.22 16.88 380 8.22 12.5
Europe 8.3 49.16 15.78 d 58 1.18 9.7
Oceania 4.7 54.04 5.20 1,028 e 19.02 16.1
Notes:
a Data from Meybeck (1979, annex 3)
b Data from Milliman and Meade (1983, Table 4)
c Includes Central America
6
2
d Milliman and Meade separate Europe (4.61 × 10 km ) and Eurasian Arctic (11.17 × 10 km )
6
2
e The sediment yield for Australia is a mere 28 t/km /yr, whereas the yield for large Pacific islands is 1,028 t/km /yr
2
2
Source: After Huggett (1991, 87)
world’s major rivers to the sea. It should be empha- grouped into relief classes. Fournier fitted an empirical
sized that these figures do not measure the total rate equation to the data:
of soil erosion, since much sediment is eroded from
2
upland areas and deposited on lowlands where it remains logE =−1.56 + 2.65 log(p /P + 0.46 log H − tan θ)
in store, so delaying for a long time its arrival at the
2
2
sea (Milliman and Meade 1983). Table 2.2 shows the where E is suspended sediment yield (t/km /yr), p /P
breakdown of chemical and mechanical denudation by is the climatic factor (mm), H is mean height of a
continent. drainage basin, and tan θ (theta) is the tangent of the
mean slope of a drainage basin. Applying this equation,
Fournier mapped the distribution of world mechanical
Factors controlling denudation rates erosion. His map portrayed maximum rates in the sea-
sonally humid tropics, declining in equatorial regions
The controls on mechanical denudation are so complex where there is no seasonal effect, and also declining in
and the data so sketchy that it is challenging to attempt arid regions, where total runoff is low.
to assess the comparative roles of the variables involved. John D. Milliman (1980) identified several natural
Undaunted, some researchers have tried to make sense of factors that appear to control the suspended sediment
the available data (e.g. Fournier 1960; Strakhov 1967). load of rivers: drainage basin relief, drainage basin area,
Frédéric Fournier (1960), using sediment data from 78 specific discharge, drainage basin geology, climate, and
drainage basins, correlated suspended sediment yield the presence of lakes. The climatic factor influences
2
with a climatic parameter, p /P, where p is the rain- suspended sediment load through mean annual tem-
fall of the month with the highest rainfall and P is the perature, total rainfall, and the seasonality of rainfall.
mean annual rainfall. Although, as might be expected, Heavy rainfall tends to generate high runoff, but heavy
sediment yields increased as rainfall increased, a bet- seasonal rainfall, as in the monsoon climate of south-
ter degree of explanation was found when basins were ern Asia, is very efficacious in producing a big load of