
Page 201 - Fundamentals of Light Microscopy and Electronic Imaging
P. 201
184 FLUORESCENCE MICROSCOPY
Absorbance/Emission
400 500 600 700
Wavelength (nm)
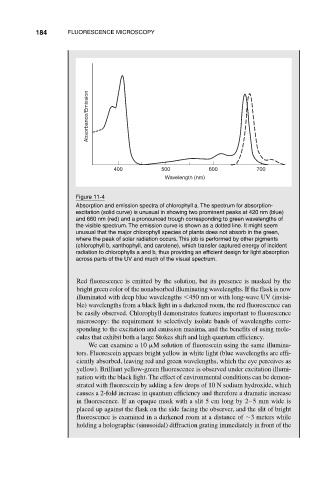
Figure 11-4
Absorption and emission spectra of chlorophyll a. The spectrum for absorption-
excitation (solid curve) is unusual in showing two prominent peaks at 420 nm (blue)
and 660 nm (red) and a pronounced trough corresponding to green wavelengths of
the visible spectrum. The emission curve is shown as a dotted line. It might seem
unusual that the major chlorophyll species of plants does not absorb in the green,
where the peak of solar radiation occurs. This job is performed by other pigments
(chlorophyll b, xanthophyll, and carotene), which transfer captured energy of incident
radiation to chlorophylls a and b, thus providing an efficient design for light absorption
across parts of the UV and much of the visual spectrum.
Red fluorescence is emitted by the solution, but its presence is masked by the
bright green color of the nonabsorbed illuminating wavelengths. If the flask is now
illuminated with deep blue wavelengths 450 nm or with long-wave UV (invisi-
ble) wavelengths from a black light in a darkened room, the red fluorescence can
be easily observed. Chlorophyll demonstrates features important to fluorescence
microscopy: the requirement to selectively isolate bands of wavelengths corre-
sponding to the excitation and emission maxima, and the benefits of using mole-
cules that exhibit both a large Stokes shift and high quantum efficiency.
We can examine a 10 M solution of fluorescein using the same illumina-
tors. Fluorescein appears bright yellow in white light (blue wavelengths are effi-
ciently absorbed, leaving red and green wavelengths, which the eye perceives as
yellow). Brilliant yellow-green fluorescence is observed under excitation illumi-
nation with the black light. The effect of environmental conditions can be demon-
strated with fluorescein by adding a few drops of 10 N sodium hydroxide, which
causes a 2-fold increase in quantum efficiency and therefore a dramatic increase
in fluorescence. If an opaque mask with a slit 5 cm long by 2–5 mm wide is
placed up against the flask on the side facing the observer, and the slit of bright
fluorescence is examined in a darkened room at a distance of 3 meters while
holding a holographic (sinusoidal) diffraction grating immediately in front of the