
Page 205 - Fundamentals of Light Microscopy and Electronic Imaging
P. 205
DAPI-DNA
Absorbance Fluorescence emission
300 350 400 450 500 550 600
Wavelength (nm)
FITC-IgG
Absorbance Fluorescence emission
350 400 450 500 550 600 650
Wavelength (nm)
Fluorescence excitation TRITC-IgG Fluorescence emission
450 500 550 600 650 700
Wavelength (nm)
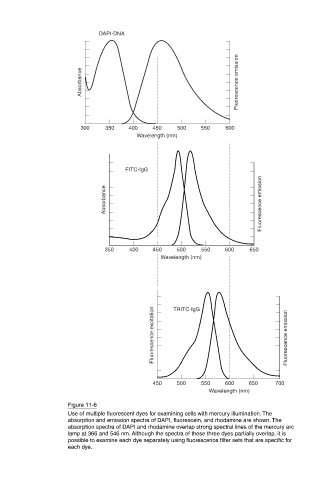
Figure 11-6
Use of multiple fluorescent dyes for examining cells with mercury illumination. The
absorption and emission spectra of DAPI, fluorescein, and rhodamine are shown. The
absorption spectra of DAPI and rhodamine overlap strong spectral lines of the mercury arc
lamp at 366 and 546 nm. Although the spectra of these three dyes partially overlap, it is
possible to examine each dye separately using fluorescence filter sets that are specific for
each dye.