
Page 303 - Fundamentals of Light Microscopy and Electronic Imaging
P. 303
286 DIGITAL IMAGE PROCESSING
255
No. pixels
(a)
Output values for image display
0
0 255
255
No. pixels
(b)
0
0 255
Input values
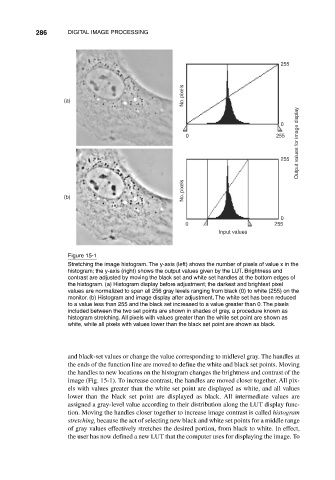
Figure 15-1
Stretching the image histogram. The y-axis (left) shows the number of pixels of value x in the
histogram; the y-axis (right) shows the output values given by the LUT. Brightness and
contrast are adjusted by moving the black set and white set handles at the bottom edges of
the histogram. (a) Histogram display before adjustment; the darkest and brightest pixel
values are normalized to span all 256 gray levels ranging from black (0) to white (255) on the
monitor. (b) Histogram and image display after adjustment. The white set has been reduced
to a value less than 255 and the black set increased to a value greater than 0. The pixels
included between the two set points are shown in shades of gray, a procedure known as
histogram stretching. All pixels with values greater than the white set point are shown as
white, while all pixels with values lower than the black set point are shown as black.
and black-set values or change the value corresponding to midlevel gray. The handles at
the ends of the function line are moved to define the white and black set points. Moving
the handles to new locations on the histogram changes the brightness and contrast of the
image (Fig. 15-1). To increase contrast, the handles are moved closer together. All pix-
els with values greater than the white set point are displayed as white, and all values
lower than the black set point are displayed as black. All intermediate values are
assigned a gray-level value according to their distribution along the LUT display func-
tion. Moving the handles closer together to increase image contrast is called histogram
stretching, because the act of selecting new black and white set points for a middle range
of gray values effectively stretches the desired portion, from black to white. In effect,
the user has now defined a new LUT that the computer uses for displaying the image. To