
Page 305 - Fundamentals of Light Microscopy and Electronic Imaging
P. 305
288 DIGITAL IMAGE PROCESSING
No. pixels
(a)
Output values for image display
Log no. pixels
(b)
Rel. no. pixels
0 255
Input values
(c)
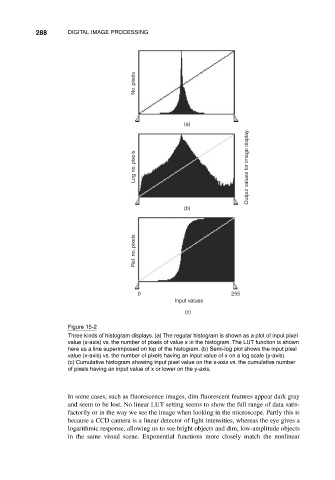
Figure 15-2
Three kinds of histogram displays. (a) The regular histogram is shown as a plot of input pixel
value (x-axis) vs. the number of pixels of value x in the histogram. The LUT function is shown
here as a line superimposed on top of the histogram. (b) Semi-log plot shows the input pixel
value (x-axis) vs. the number of pixels having an input value of x on a log scale (y-axis).
(c) Cumulative histogram showing input pixel value on the x-axis vs. the cumulative number
of pixels having an input value of x or lower on the y-axis.
In some cases, such as fluorescence images, dim fluorescent features appear dark gray
and seem to be lost. No linear LUT setting seems to show the full range of data satis-
factorily or in the way we see the image when looking in the microscope. Partly this is
because a CCD camera is a linear detector of light intensities, whereas the eye gives a
logarithmic response, allowing us to see bright objects and dim, low-amplitude objects
in the same visual scene. Exponential functions more closely match the nonlinear