Page 160 - Fundamentals of Probability and Statistics for Engineers
P. 160

Functions of Random Variables                                   143

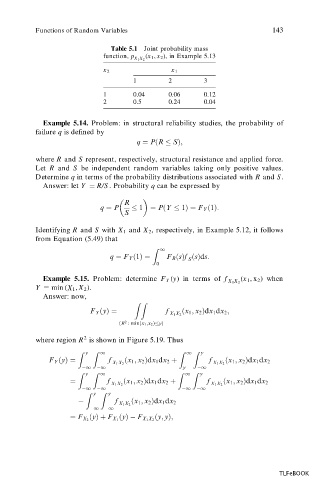
                               Table 5.1  Joint probability mass
                             function, p  (x 1 , x 2 ), in Example 5.13
                                     X 1 X 2
                             x 2               x 1
                                     1         2        3

                             1       0.04      0.06     0.12
                             2       0.5       0.24     0.04

             Example 5.14. Problem: in structural reliability studies, the probability of
           failure q is defined by
                                      q ˆ P…R   S†;

           where R and S represent, respectively, structural resistance and applied force.
           Let  R  and  S  be independent  random  variables taking  only  positive  values.
           Determine q in terms of the probability distributions associated with R and S.
             Answer: let Y ˆ  R/S . Probability q can be expressed by


                                   R
                            q ˆ P      1  ˆ P…Y   1†ˆ F Y …1†:
                                   S
           Identifying R and S with X 1  and X 2 , respectively, in Example 5.12, it  follows
           from Equation (5.49) that
                                          Z  1
                               q ˆ F Y …1†ˆ   F R …s†f …s†ds:
                                                    S
                                           0


             Example 5.15. Problem:  determine  F Y   (y)  in  terms  of  f   (x 1 , x 2 ) when


                                                               X 1 X 2
           Y  ˆ  min (X 1 , X 2 ).
             Answer: now,
                                     ZZ
                         F Y …y†ˆ             f   …x 1 ; x 2 †dx 1 dx 2 ;
                                               X 1 X 2
                                 …R : min…x 1 ;x 2 † y†
                                   2
                        2
           where region R is shown in Figure 5.19. Thus
                        y   1                      1   y
                      Z   Z                      Z   Z
              F Y …y†ˆ        f    …x 1 ; x 2 †dx 1 dx 2 ‡  f  …x 1 ; x 2 †dx 1 dx 2
                               X 1 X 2                     X 1 X 2
                       
1  
1                     y   
1
                      Z  y  Z  1                 Z  1  Z  y
                    ˆ         f   …x 1 ; x 2 †dx 1 dx 2 ‡  f  …x 1 ; x 2 †dx 1 dx 2
                               X 1 X 2                    X 1 X 2
                       
1  
1                     
1  
1
                        Z  y  Z  y
                      
         f   …x 1 ; x 2 †dx 1 dx 2
                                 X 1 X 2
                         
1  
1
                                           …y; y†;
                    ˆ F X 2  …y†‡ F X 1  …y†
 F X 1 X 2


                                                                            TLFeBOOK
   155   156   157   158   159   160   161   162   163   164   165