Page 158 - Fundamentals of Probability and Statistics for Engineers
P. 158

Functions of Random Variables                                   141

                               f (y)
                                Y


                                2


                                1


                                                                 y
                                 0          1          2

                   Figure 5.17 Probability density function, f (y), in Example 5.11


                                                     Y
                                x
                                 2


                                      R 2
                                                      x 1
                                                      — = y
                                                      x 2


                                                                 x 1


                                              2


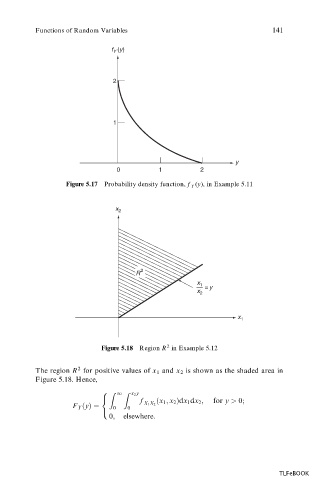
                            Figure 5.18 Region R in Example 5.12
                      2
           The region R for positive values of x 1  and x 2  is shown as the shaded area in
           Figure 5.18. Hence,
                               Z  1  Z  x 2 y
                            8
                                       f   …x 1 ; x 2 †dx 1 dx 2 ;  for y > 0;
                            <
                     F Y …y†ˆ   0  0    X 1 X 2
                            :
                               0;  elsewhere:


                                                                            TLFeBOOK
   153   154   155   156   157   158   159   160   161   162   163