
Page 266 - Fundamentals of Probability and Statistics for Engineers
P. 266
Observed Data and Graphical Representation 249
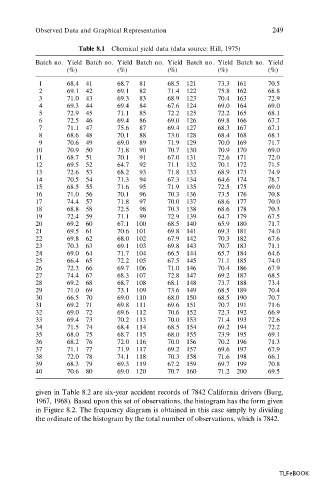
Table 8.1 Chemical yield data (data source: Hill, 1975)
Batch no. Yield Batch no. Yield Batch no. Yield Batch no. Yield Batch no. Yield
(%) (%) (%) (%) (%)
1 68.4 41 68.7 81 68.5 121 73.3 161 70.5
2 69.1 42 69.1 82 71.4 122 75.8 162 68.8
3 71.0 43 69.3 83 68.9 123 70.4 163 72.9
4 69.3 44 69.4 84 67.6 124 69.0 164 69.0
5 72.9 45 71.1 85 72.2 125 72.2 165 68.1
6 72.5 46 69.4 86 69.0 126 69.8 166 67.7
7 71.1 47 75.6 87 69.4 127 68.3 167 67.1
8 68.6 48 70.1 88 73.0 128 68.4 168 68.1
9 70.6 49 69.0 89 71.9 129 70.0 169 71.7
10 70.9 50 71.8 90 70.7 130 70.9 170 69.0
11 68.7 51 70.1 91 67.0 131 72.6 171 72.0
12 69.5 52 64.7 92 71.1 132 70.1 172 71.5
13 72.6 53 68.2 93 71.8 133 68.9 173 74.9
14 70.5 54 71.3 94 67.3 134 64.6 174 78.7
15 68.5 55 71.6 95 71.9 135 72.5 175 69.0
16 71.0 56 70.1 96 70.3 136 73.5 176 70.8
17 74.4 57 71.8 97 70.0 137 68.6 177 70.0
18 68.8 58 72.5 98 70.3 138 68.6 178 70.3
19 72.4 59 71.1 99 72.9 139 64.7 179 67.5
20 69.2 60 67.1 100 68.5 140 65.9 180 71.7
21 69.5 61 70.6 101 69.8 141 69.3 181 74.0
22 69.8 62 68.0 102 67.9 142 70.3 182 67.6
23 70.3 63 69.1 103 69.8 143 70.7 183 71.1
24 69.0 64 71.7 104 66.5 144 65.7 184 64.6
25 66.4 65 72.2 105 67.5 145 71.1 185 74.0
26 72.3 66 69.7 106 71.0 146 70.4 186 67.9
27 74.4 67 68.3 107 72.8 147 69.2 187 68.5
28 69.2 68 68.7 108 68.1 148 73.7 188 73.4
29 71.0 69 73.1 109 73.6 149 68.5 189 70.4
30 66.5 70 69.0 110 68.0 150 68.5 190 70.7
31 69.2 71 69.8 111 69.6 151 70.7 191 71.6
32 69.0 72 69.6 112 70.6 152 72.3 192 66.9
33 69.4 73 70.2 113 70.0 153 71.4 193 72.6
34 71.5 74 68.4 114 68.5 154 69.2 194 72.2
35 68.0 75 68.7 115 68.0 155 73.9 195 69.1
36 68.2 76 72.0 116 70.0 156 70.2 196 71.3
37 71.1 77 71.9 117 69.2 157 69.6 197 67.9
38 72.0 78 74.1 118 70.3 158 71.6 198 66.1
39 68.3 79 69.3 119 67.2 159 69.7 199 70.8
40 70.6 80 69.0 120 70.7 160 71.2 200 69.5
given in Table 8.2 are six-year accident records of 7842 California drivers (Burg,
1967, 1968). Based upon this set of observations, the histogram has the form given
in Figure 8.2. The frequency diagram is obtained in this case simply by dividing
the ordinate of the histogram by the total number of observations, which is 7842.
TLFeBOOK