Page 268 - Fundamentals of Probability and Statistics for Engineers
P. 268

Observed Data and Graphical Representation                      251


                           6000


                         Number of observations  4000


                           2000


                             0
                              0     1    2    3    4    5    6
                                    Number of accidents in six years

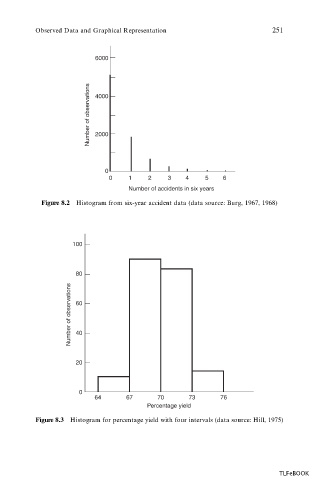
            Figure 8.2 Histogram from six-year accident data (data source: Burg, 1967, 1968)


                     100


                      80
                    Number of observations  60


                      40


                      20


                      0
                           64      67       70      73       76
                                         Percentage yield
           Figure 8.3  Histogram for percentage yield with four intervals (data source: Hill, 1975)


                                                                            TLFeBOOK
   263   264   265   266   267   268   269   270   271   272   273