
Page 318 - Fundamentals of Probability and Statistics for Engineers
P. 318
Parameter Estimation 301
f (t)
T
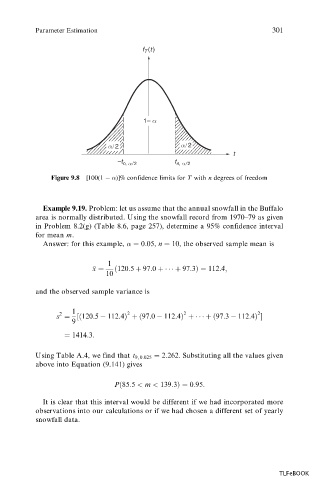
1– α
α/ 2 α/ 2
t
–t n, α / 2 t n, α / 2
Figure 9.8 [100(1 )]% confidence limits for T with n degrees of freedom
Example 9.19. Problem: let us assume that the annual snowfall in the Buffalo
area is normally distributed. Using the snowfall record from 1970–79 as given
in Problem 8.2(g) (Table 8.6, page 257), determine a 95% confidence interval
for mean m.
Answer: for this example, 0:05, n 10, the observed sample mean is
1
x
120:5 97:0 97:3 112:4;
10
and the observed sample variance is
1 2 2 2
2
s
120:5 112:4
97:0 112:4
97:3 112:4
9
1414:3:
Using Table A.4, we find that t 9, 0:025 2:262. Substituting all the values given
above into Equation (9.141) gives
P
85:5 < m < 139:3 0:95:
It is clear that this interval would be different if we had incorporated more
observations into our calculations or if we had chosen a different set of yearly
snowfall data.
TLFeBOOK