
Page 314 - Fundamentals of Probability and Statistics for Engineers
P. 314
Parameter Estimation 297
(u)
f U
1–α
α /2 α /2
u
−u α /2 0 u α /2
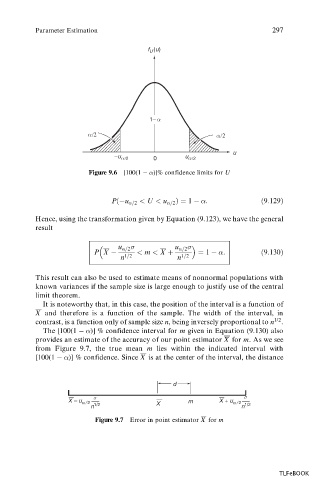
Figure 9.6 [100(1 )]% confidence limits for U
P
u =2 < U < u =2 1 :
9:129
Hence, using the transformation given by Equation (9.123), we have the general
result
u =2 u =2
P X < m < X 1 :
9:130
n 1=2 n 1=2
This result can also be used to estimate means of nonnormal populations with
known variances if the sample size is large enough to justify use of the central
limit theorem.
It is noteworthy that, in this case, the position of the interval is a function of
X and therefore is a function of the sample. The width of the interval, in
1/2
contrast, is a function only of sample size n, being inversely proportional to n .
The [100(1 )] % confidence interval for m given in Equation (9.130) also
provides an estimate of the accuracy of our point estimator X for m. As we see
from Figure 9.7, the true mean m lies within the indicated interval with
[100(1 )] % confidence. Since X is at the center of the interval, the distance
d
σ σ
X – u α / 2 — m X + u α / 2
n 1/2 X n 1/2
Figure 9.7 Error in point estimator X for m
TLFeBOOK