
Page 348 - Fundamentals of Probability and Statistics for Engineers
P. 348
Model Verification 331
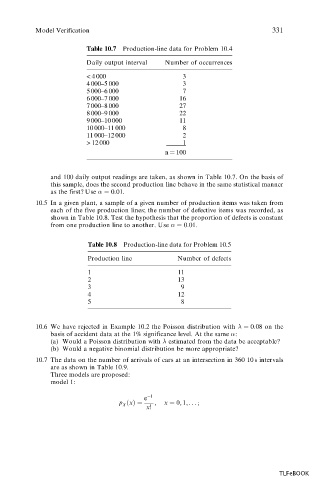
Table 10.7 Production-line data for Problem 10.4
Daily output interval Number of occurrences
< 4 000 3
4 000–5 000 3
5 000–6 000 7
6 000–7 000 16
7 000–8 000 27
8 000–9 000 22
9 000–10 000 11
10 000–11 000 8
11 000–12 000 2
> 12 000 1
n 100
and 100 daily output readings are taken, as shown in Table 10.7. On the basis of
this sample, does the second production line behave in the same statistical manner
0 01.
as the first? Use :
10.5 In a given plant, a sample of a given number of production items was taken from
each of the five production lines; the number of defective items was recorded, as
shown in Table 10.8. Test the hypothesis that the proportion of defects is constant
0 01.
from one production line to another. Use :
Table 10.8 Production-line data for Problem 10.5
Production line Number of defects
1 11
2 13
3 9
4 12
5 8
10.6 We have rejected in Example 10.2 the Poisson distribution with :
0 08 on the
basis of accident data at the 1% significance level. At the same :
(a) Would a Poisson distribution with estimated from the data be acceptable?
(b) Would a negative binomial distribution be more appropriate?
10.7 The data on the number of arrivals of cars at an intersection in 360 10 s intervals
are as shown in Table 10.9.
Three models are proposed:
model 1:
e 1
p
x ; x 0; 1; ...;
X
x!
TLFeBOOK