Page 349 - Fundamentals of Probability and Statistics for Engineers
P. 349

332                    Fundamentals of Probability and Statistics for Engineers

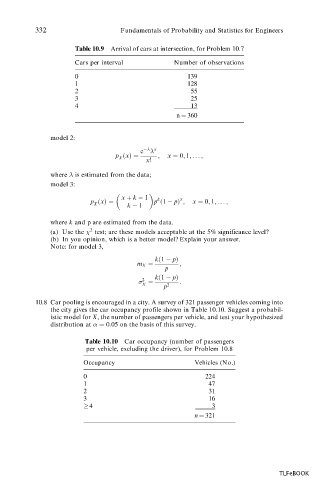
                     Table 10.9 Arrival of cars at intersection, for Problem 10.7
                     Cars per interval          Number of observations
                     0                              139
                     1                              128
                     2                               55
                     3                               25
                     4                               13
                                                 n ˆ 360


               model 2:
                                           x
                                       e
                                p …x†ˆ      ;  x ˆ 0; 1; .. . ;
                                 X
                                        x!
               where    is estimated from the data;
               model 3:

                                  x ‡ k   1       x
                                            k
                         p …x†ˆ    k   1   p …1   p† ;  x ˆ 0; 1; ... ;
                          X
               where k and p are estimated from the data.
               (a) Use the   2  test; are these models acceptable at the 5% significance level?
               (b) In you opinion, which is a better model? Explain your answer.
               Note: for model 3,
                                           k…1   p†
                                      m X ˆ       ;
                                              p
                                           k…1   p†
                                       2
                                        ˆ         :
                                       X     p 2
           10.8 Car pooling is encouraged in a city. A survey of 321 passenger vehicles coming into
               the city gives the car occupancy profile shown in Table 10.10. Suggest a probabil-
               istic model for X, the number of passengers per vehicle, and test your hypothesized
               distribution at   ˆ :
                              0 05 on the basis of this survey.
                        Table 10.10 Car occupancy (number of passengers
                        per vehicle, excluding the driver), for Problem 10.8

                        Occupancy                     Vehicles (No.)
                        0                               224
                        1                                47
                        2                                31
                        3                                16
                          4                               3
                                                      n ˆ 321


                                                                            TLFeBOOK
   344   345   346   347   348   349   350   351   352   353   354