
Page 346 - Fundamentals of Probability and Statistics for Engineers
P. 346
Model Verification 329
:
:
The values of F X [x (i) ] can now be found based on distribution N(30 3, 3 14) for
X. For example, with the aid of Table A.3 for standardized normal random
variable U, we have
27:4 30:3
F X
27:4 F U p F U
1:64
3:14
1 F U
1:64 1 0:9495 0:0505;
28:7 30:3
F X
28:7 F U p F U
0:90
3:14
1 0:8159 0:1841;
and so on.
0
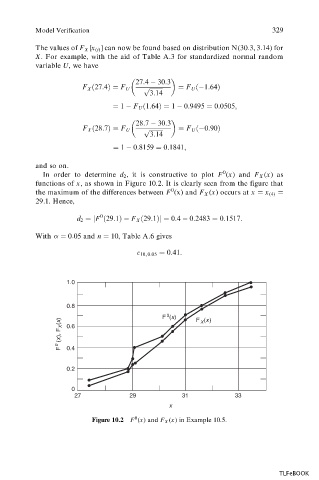
In order to determine d 2 , it is constructive to plot F (x) and F X (x) as
functions of x, as shown in Figure 10.2. It is clearly seen from the figure that
0
the maximum of the differences between F (x) and F X (x) occurs at x x (4)
:
29 1. Hence,
0
d 2 jF
29:1 F X
29:1j 0:4 0:2483 0:1517:
0 05 and n
With : 10, Table A.6 gives
c 10; 0:05 0:41:
1.0
0.8
0
F (x) F (x)
F X (x) 0.6 X
(x),
F 0 0.4
0.2
0
27 29 31 33
x
0
Figure 10.2 F (x) and F X (x) in Example 10.5.
TLFeBOOK