Page 342 - Fundamentals of Probability and Statistics for Engineers
P. 342

Model Verification                                              325

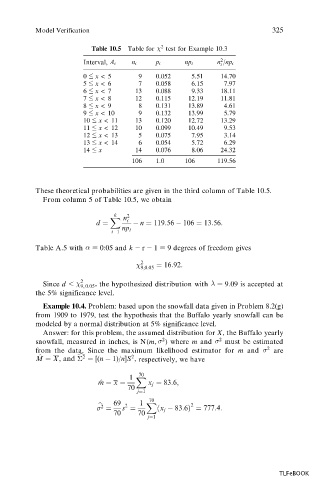
                          Table 10.5 Table for   2  test for Example 10.3
                                                             2
                        Interval, A i  n i  p i    np i     n /np i
                                                             i
                        0    x <  5   9    0.052     5.51    14.70
                        5    x <  6   7    0.058     6.15     7.97
                        6    x <  7   13   0.088     9.33    18.11
                        7    x <  8   12   0.115    12.19    11.81
                        8    x <  9   8    0.131    13.89     4.61
                        9    x <  10  9    0.132    13.99     5.79
                        10    x <  11  13  0.120    12.72    13.29
                        11    x <  12  10  0.099    10.49     9.53
                        12    x <  13  5   0.075     7.95     3.14
                        13    x <  14  6   0.054     5.72     6.29
                        14    x       14   0.076     8.06    24.32
                                     106   1.0     106      119.56


           These theoretical probabilities are given in the third column of Table 10.5.
             From column 5 of Table 10.5, we obtain

                                k  2
                               X  n i
                           d ˆ         n ˆ 119:56   106 ˆ 13:56:
                                  np i
                               iˆ1
           Table A.5 with   ˆ  0:05 and k      1 ˆ  9 degrees of freedom gives
                                       r
                                        2  ˆ 16:92:
                                       9;0:05
             Since d <  2 9, 0:05 ,  the hypothesized distribution with   ˆ :
                                                              9 09 is accepted at
           the 5% significance level.
             Example 10.4. Problem: based upon the snowfall data given in Problem 8.2(g)
           from 1909 to 1979, test the hypothesis that the Buffalo yearly snowfall can be
           modeled by a normal distribution at 5% significance level.
             Answer: for this problem, the assumed distribution for X, the Buffalo yearly
           snowfall,  measured  in  inches,  is N(m,   2 ) where m and   2  must be estimated
           from  the  data.  Since  the  maximum  likelihood  estimator  for  m  and   2  are
           ^
                                     2
           M ˆ X, and   ˆ [-n   1)/n]S ,  respectively, we have
                      c 2
                                       70
                                    1  X
                            ^ m ˆ x ˆ    x j ˆ 83:6;
                                   70
                                      jˆ1
                                         70
                                69  2  1  X          2
                            b 2
                             ˆ    s ˆ      …x j   83:6† ˆ 777:4:
                                70    70
                                         jˆ1


                                                                            TLFeBOOK
   337   338   339   340   341   342   343   344   345   346   347