
Page 163 - Fundamentals of Radar Signal Processing
P. 163
illuminated circular and rectangular apertures.
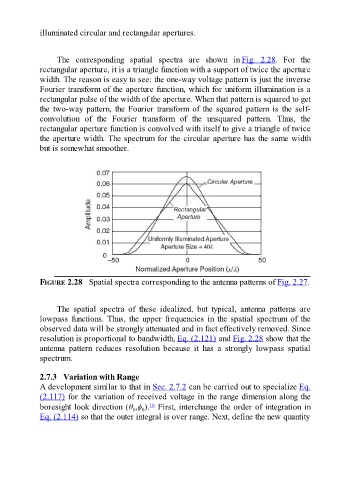
The corresponding spatial spectra are shown in Fig. 2.28. For the
rectangular aperture, it is a triangle function with a support of twice the aperture
width. The reason is easy to see: the one-way voltage pattern is just the inverse
Fourier transform of the aperture function, which for uniform illumination is a
rectangular pulse of the width of the aperture. When that pattern is squared to get
the two-way pattern, the Fourier transform of the squared pattern is the self-
convolution of the Fourier transform of the unsquared pattern. Thus, the
rectangular aperture function is convolved with itself to give a triangle of twice
the aperture width. The spectrum for the circular aperture has the same width
but is somewhat smoother.
FIGURE 2.28 Spatial spectra corresponding to the antenna patterns of Fig. 2.27.
The spatial spectra of these idealized, but typical, antenna patterns are
lowpass functions. Thus, the upper frequencies in the spatial spectrum of the
observed data will be strongly attenuated and in fact effectively removed. Since
resolution is proportional to bandwidth, Eq. (2.121) and Fig. 2.28 show that the
antenna pattern reduces resolution because it has a strongly lowpass spatial
spectrum.
2.7.3 Variation with Range
A development similar to that in Sec. 2.7.2 can be carried out to specialize Eq.
(2.117) for the variation of received voltage in the range dimension along the
10
boresight look direction (θ ,ϕ ). First, interchange the order of integration in
0
0
Eq. (2.114) so that the outer integral is over range. Next, define the new quantity