
Page 272 - Fundamentals of Radar Signal Processing
P. 272
(4.94)
The final result is
(4.95)
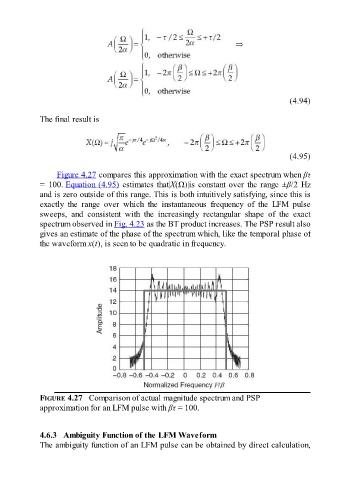
Figure 4.27 compares this approximation with the exact spectrum when βτ
= 100. Equation (4.95) estimates that|X(Ω)|is constant over the range ±β/2 Hz
and is zero outside of this range. This is both intuitively satisfying, since this is
exactly the range over which the instantaneous frequency of the LFM pulse
sweeps, and consistent with the increasingly rectangular shape of the exact
spectrum observed in Fig. 4.23 as the BT product increases. The PSP result also
gives an estimate of the phase of the spectrum which, like the temporal phase of
the waveform x(t), is seen to be quadratic in frequency.
FIGURE 4.27 Comparison of actual magnitude spectrum and PSP
approximation for an LFM pulse with βτ = 100.
4.6.3 Ambiguity Function of the LFM Waveform
The ambiguity function of an LFM pulse can be obtained by direct calculation,