
Page 318 - Fundamentals of Radar Signal Processing
P. 318
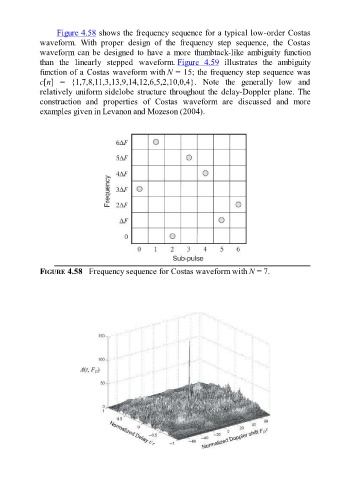
Figure 4.58 shows the frequency sequence for a typical low-order Costas

               waveform.  With  proper  design  of  the  frequency  step  sequence,  the  Costas
               waveform  can  be  designed  to  have  a  more  thumbtack-like  ambiguity  function
               than  the  linearly  stepped  waveform. Figure  4.59  illustrates  the  ambiguity
               function of a Costas waveform with N = 15; the frequency step sequence was
               c[n]  =  {1,7,8,11,3,13,9,14,12,6,5,2,10,0,4}.  Note  the  generally  low  and
               relatively uniform sidelobe structure throughout the delay-Doppler plane. The

               construction  and  properties  of  Costas  waveform  are  discussed  and  more
               examples given in Levanon and Mozeson (2004).


               FIGURE 4.58   Frequency sequence for Costas waveform with N = 7.