
Page 358 - Fundamentals of Radar Signal Processing
P. 358
false alarm achievable in the system in a manner dependent on the particular
design of the detection system.
There are three principal MTI figures of merit in use. Clutter attenuation
measures only the reduction in clutter power at the output of the MTI filter as
compared to the input, but is simplest to compute. Improvement factor
quantifies the increase in signal-to-clutter ratio due to MTI filtering; as such, it
accounts for the effect of the filter on the target as well as on the clutter.
Subclutter visibility is a more complex measure that also takes into account the
detection and false alarm probabilities and the detector characteristic. Because
of its complexity, it is less often used. In this chapter, attention is concentrated
on clutter attenuation CA and improvement factor I.
There are several ways to approach the calculation of the improvement
factor. These include frequency domain approaches using clutter power spectra
and MTI filter transfer functions, autocorrelation functions of the input and
output of the MTI filter, and the vector method. Each will be illustrated in turn,
starting with the frequency domain approach, which is perhaps the most
intuitive.
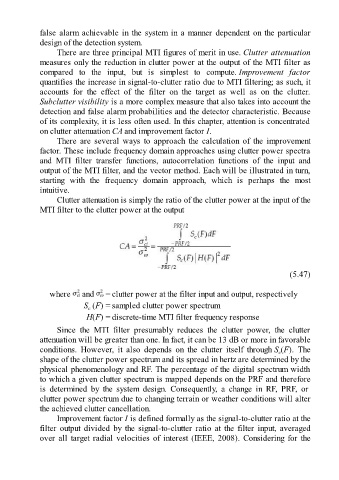
Clutter attenuation is simply the ratio of the clutter power at the input of the
MTI filter to the clutter power at the output
(5.47)
where and = clutter power at the filter input and output, respectively
S (F) = sampled clutter power spectrum
c
H(F) = discrete-time MTI filter frequency response
Since the MTI filter presumably reduces the clutter power, the clutter
attenuation will be greater than one. In fact, it can be 13 dB or more in favorable
conditions. However, it also depends on the clutter itself through S (F). The
c
shape of the clutter power spectrum and its spread in hertz are determined by the
physical phenomenology and RF. The percentage of the digital spectrum width
to which a given clutter spectrum is mapped depends on the PRF and therefore
is determined by the system design. Consequently, a change in RF, PRF, or
clutter power spectrum due to changing terrain or weather conditions will alter
the achieved clutter cancellation.
Improvement factor I is defined formally as the signal-to-clutter ratio at the
filter output divided by the signal-to-clutter ratio at the filter input, averaged
over all target radial velocities of interest (IEEE, 2008). Considering for the