
Page 396 - Fundamentals of Radar Signal Processing
P. 396
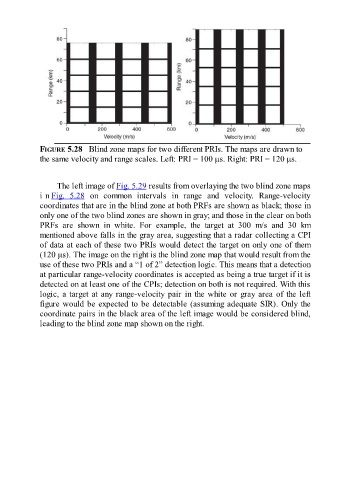
FIGURE 5.28   Blind zone maps for two different PRIs. The maps are drawn to
               the same velocity and range scales. Left: PRI = 100 μs. Right: PRI = 120 μs.


                     The left image of Fig. 5.29 results from overlaying the two blind zone maps
               i n Fig.  5.28  on  common  intervals  in  range  and  velocity.  Range-velocity
               coordinates that are in the blind zone at both PRFs are shown as black; those in
               only one of the two blind zones are shown in gray; and those in the clear on both

               PRFs  are  shown  in  white.  For  example,  the  target  at  300  m/s  and  30  km
               mentioned above falls in the gray area, suggesting that a radar collecting a CPI
               of data at each of these two PRIs would detect the target on only one of them
               (120 μs). The image on the right is the blind zone map that would result from the
               use of these two PRIs and a “1 of 2” detection logic. This means that a detection
               at particular range-velocity coordinates is accepted as being a true target if it is

               detected on at least one of the CPIs; detection on both is not required. With this
               logic, a target at any range-velocity pair in the white or gray area of the left
               figure would be expected to be detectable (assuming adequate SIR). Only the
               coordinate pairs in the black area of the left image would be considered blind,
               leading to the blind zone map shown on the right.