
Page 397 - Fundamentals of Radar Signal Processing
P. 397
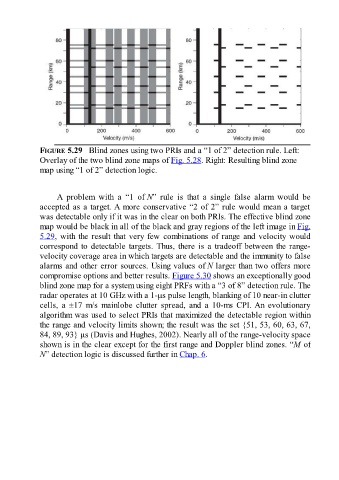
FIGURE 5.29   Blind zones using two PRIs and a “1 of 2” detection rule. Left:
               Overlay of the two blind zone maps of Fig. 5.28. Right: Resulting blind zone
               map using “1 of 2” detection logic.


                     A  problem  with  a  “1  of N”  rule  is  that  a  single  false  alarm  would  be

               accepted as a target. A more conservative “2 of 2” rule would mean a target
               was detectable only if it was in the clear on both PRIs. The effective blind zone
               map would be black in all of the black and gray regions of the left image in Fig.
               5.29, with the result that very few combinations of range and velocity would
               correspond to detectable targets. Thus, there is a tradeoff between the range-
               velocity coverage area in which targets are detectable and the immunity to false

               alarms and other error sources. Using values of N larger than two offers more
               compromise options and better results. Figure 5.30 shows an exceptionally good
               blind zone map for a system using eight PRFs with a “3 of 8” detection rule. The
               radar operates at 10 GHz with a 1-μs pulse length, blanking of 10 near-in clutter
               cells,  a  ±17  m/s  mainlobe  clutter  spread,  and  a  10-ms  CPI. An  evolutionary
               algorithm was used to select PRIs that maximized the detectable region within
               the range and velocity limits shown; the result was the set {51, 53, 60, 63, 67,

               84, 89, 93} μs (Davis and Hughes, 2002). Nearly all of the range-velocity space
               shown is in the clear except for the first range and Doppler blind zones. “M of
               N” detection logic is discussed further in Chap. 6.