
Page 151 - Fundamentals of Reservoir Engineering
P. 151
MATERIAL BALANCE APPLIED TO OIL RESERVOIRS 90
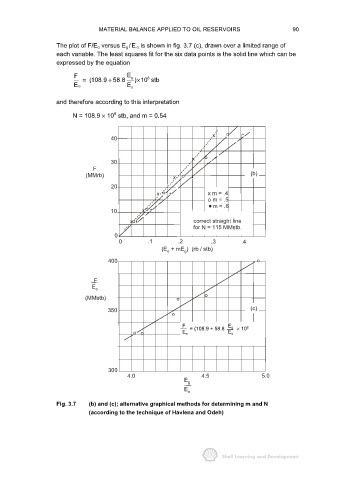
The plot of F/E o versus E g /E o is shown in fig. 3.7 (c), drawn over a limited range of
each variable. The least squares fit for the six data points is the solid line which can be
expressed by the equation
F E g 6
= (108.9 58.8 ) 10 stb
×
+
E o E o
and therefore according to this interpretation
6
N = 108.9 × 10 stb, and m = 0.54
40
30
F
(MMrb) (b)
20
20
x m = .4
o m = .5
m = .6
10
correct straight line
for N = 115 MMstb.
0
0 .1 .2 .3 .4
(E + mE ) (rb / stb)
g
o
400
F
E o
(MMstb)
350 (c)
F = (108.9 + 58.8 E g × 10 6
E o E o
300
4.0 4.5 5.0
E g
E o
Fig. 3.7 (b) and (c); alternative graphical methods for determining m and N
(according to the technique of Havlena and Odeh)